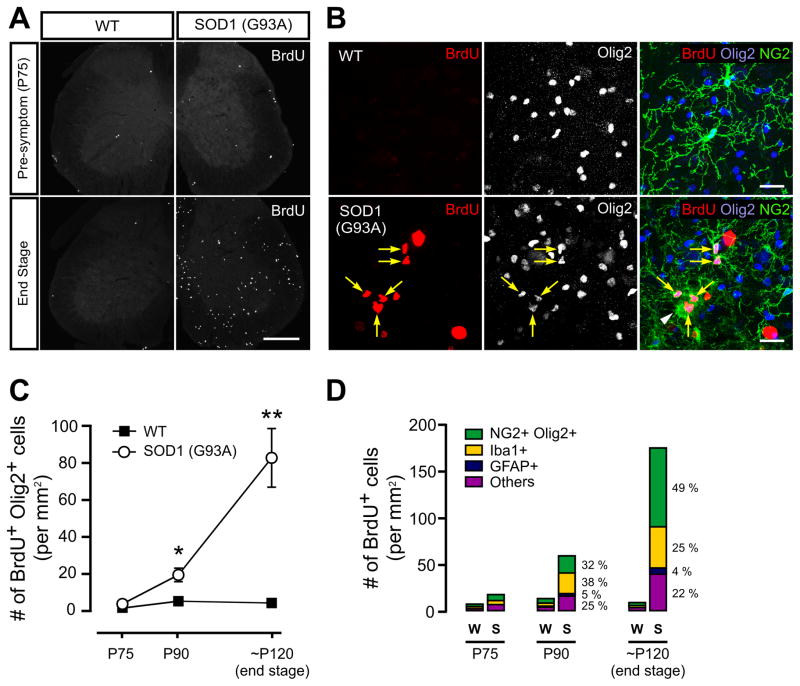
Figure 7. Enhanced proliferation of NG2+ cells in the spinal cord of ALS mice.
(A) Sections of lumbar spinal cord from wild type (WT) and SOD1 mutant (G93A) mice showing BrdU+ cells at the presymptomatic (upper panels) and end stages (lower panels). Scale bars = 500 μm.
(B) Confocal images showing BrdU, Olig2 and NG2 immunoreactivity in the lumbar spinal cord gray matter from WT and SOD1 (G93A) mice at end stage. Yellow arrows indicate BrdU+NG2+ cells, and the white arrowhead represents an NG2-expressing macrophage/microglia-like cell (Iba1+Olig2−). Scale bars = 20μm.
(C) Plot of the number of BrdU+ Olig2+ cells in the lumbar spinal cord of wild type and SOD1 (G93A) mice during disease progression (from P75 to end stage). The number of BrdU+ Olig2+ cells was significantly greater at P90 and end stage in SOD1 (G93A) mice than in age matched wild type littermates. * p <0.05. ** p < 0.0001. Statistical comparisons were made by Student’s t-test.
(D) Histograms showing the number of NG2+ cells (NG2+Olig2+), microglial cells (Iba1+), astrocytes (GFAP+) and other (undefined) cells that were BrdU+ in the lumbar spinal cord of wildtype and SOD1 (G93A) mice at different ages.

