
FIG. 3.
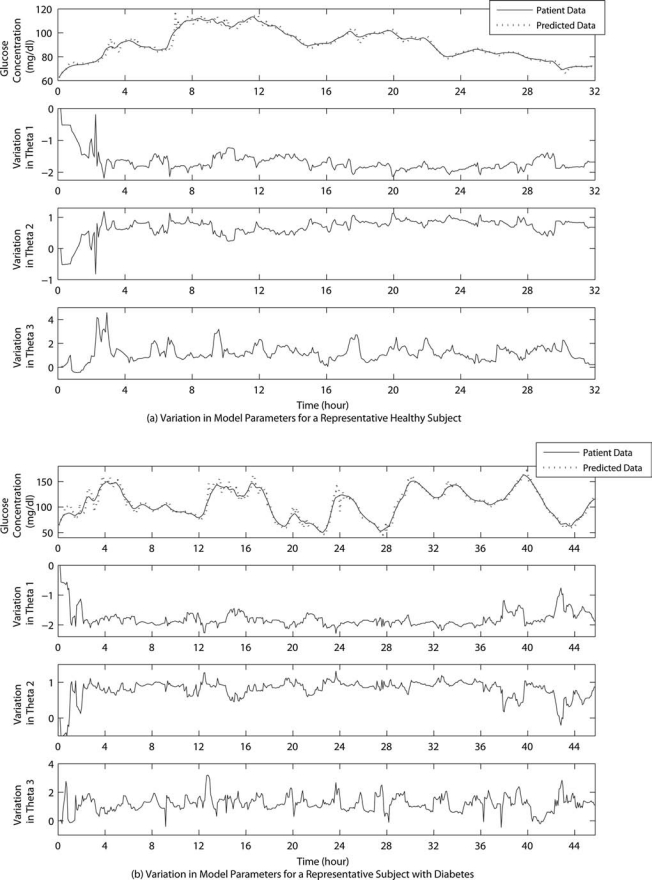
Variation in model parameters for a representative (a) healthy subject and (b) subject with type 2 diabetes for Group B. Predicted glucose concentrations are for a PH of six time steps. Representative subjects are the same as in Figure 2.
Official websites use .gov
A
.gov website belongs to an official
government organization in the United States.
Secure .gov websites use HTTPS
A lock (
) or https:// means you've safely
connected to the .gov website. Share sensitive
information only on official, secure websites.
Variation in model parameters for a representative (a) healthy subject and (b) subject with type 2 diabetes for Group B. Predicted glucose concentrations are for a PH of six time steps. Representative subjects are the same as in Figure 2.