FIGURE 3.
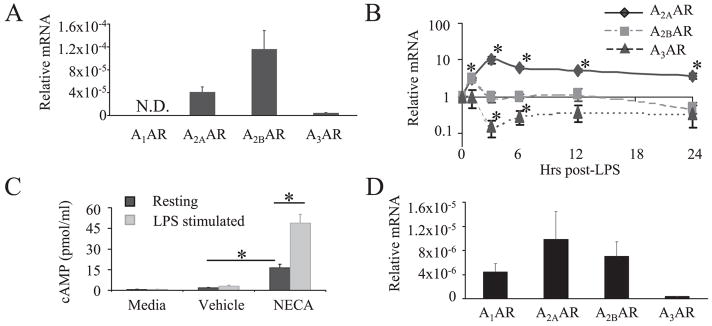
DC expression of adenosine receptors as measured by real-time RT-PCR and cAMP functional studies. A, Adenosine receptor mRNA in resting BMDC. Data represent the mean ± SEM from 10 or more experiments B, Kinetics of adenosine receptor mRNA expression in LPS-stimulated BMDC. Each gene transcript was compared with resting transcript levels. Data represent the mean ± SEM from three experiments. C, cAMP produced by BMDC treated with 250 nM NECA or DMSO vehicle control for 15 min in presence of 1 μM rolipram. In some cases cells had been treated overnight with 500 ng/ml LPS. Data represent the mean ± SEM from three or more experiments. D, MACS CD11c-enriched cells were isolated from intestinal lamina propria as described in Materials and Methods, and adenosine receptor mRNA was evaluated. Data represent the mean ± SEM from three experiments.*, p < 0.05.

