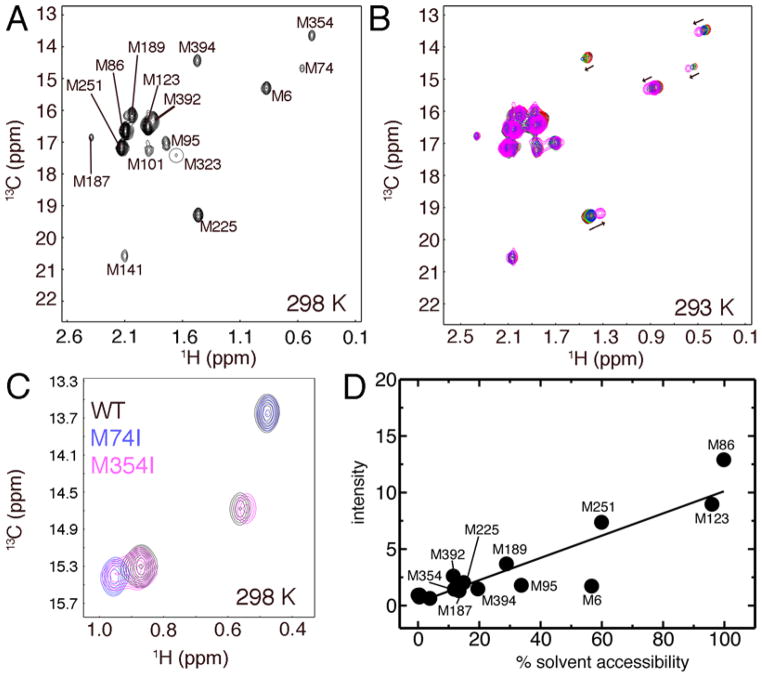
Figure 2.
Assignment of the [methyl-13C]-methionine WT 3Dpol NMR spectrum. A. The 1H-13C HSQC spectra of WT 3Dpol obtained at 298 K (300 μM 3Dpol in 25 mM potassium phosphate pH 8.0, 150 mM NaCl, 1mM DTT, 0.02% w/v NaN3 in 2H2O). B. WT 3Dpol titrated with the paramagnetic metal Co2+ at 293 K. The protein concentration of 3Dpol was 180 μM. Co2+ concentrations were 0 (black), 10 (red), 50 (green), 100 (blue) and 300 (magenta) μM. C. Comparion of the 1H-13C HSQC spectra of WT (black), Met74Ile (blue) and Met354Ile (magneta) 3Dpol at 298 K. D. Correlation between solvent accessibility and peak intensity. The percent solvent accessibilities were determined using the GETAREA program with the default radius for the water probe (1.4 Å) (57).

