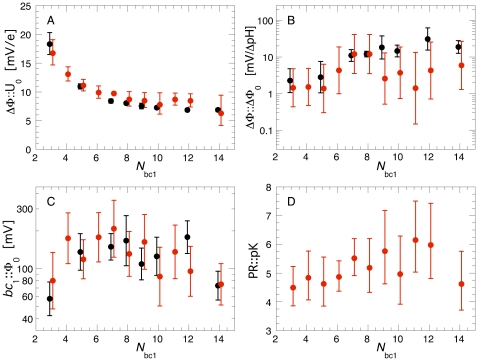
Figure 3. Optimal Parameter Values vs. Number of bc 1 Dimers.
Average parameter values from the best 100 individuals (out of the 840 individual optimizations) vs. the number of bc 1 complexes N bc1. In the two optimizations shown, we simulated the course of the transmembrane voltage ΔΦcap and of the cytochrome c oxidation state during a single flash experiment with dark-adapted bacteria (see text for further explanations). The black data points show the results from the first optimization round where ΔΦ::U0, ΔΦ::ΔΦ0, and bc 1::Φ0 were optimized. In the second round (red symbols) also PR::pK was considered.

