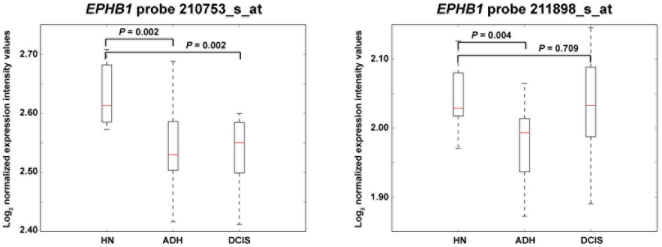
Figure 2. Early change of EPHB1 expression in breast carcinogenesis.
The graphs show expression profiles in histologically normal (HN) breast tissues versus patient-matched atypical ductal hyperplasia (ADH) and ductal carcinoma in situ (DCIS) [41]. Results of two EPHB1 microarray probes (names shown at the top) and the corresponding significance P values are shown.

