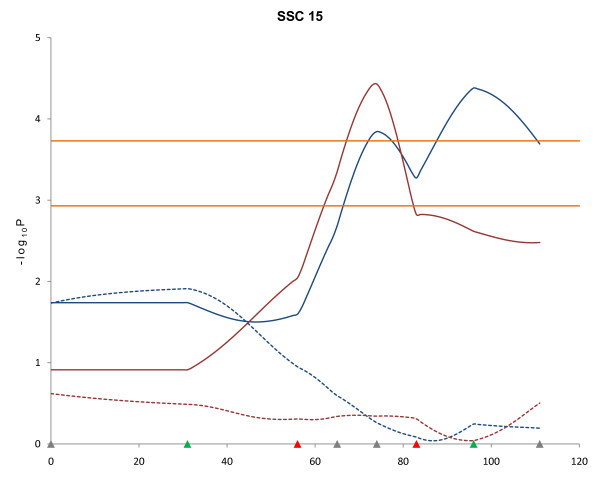
Figure 4.
QTL results determined by different models for 10th rib backfat (BF10) at 19 and 22 weeks of age on SSC15. Blue and red solid lines indicate BF10 at 19- and 22-wk, respectively, detected with the half-sib model (FDR ≤ 0.005). Blue and red dotted lines indicate BF10 at 19- and 22-wk, respectively, detected with the line-cross model. Marker positions are shown as triangles on the X-axis (gray, markers used for both QTL scans and genotyped only in 510 animals; green, markers used for both QTL scans and genotyped in all animals; red, markers used for second scan only and genotyped in all animals). Horizontal lines indicate significance thresholds (lower line, 5% FDR; upper line, 1% FDR).

