
Figure 7.
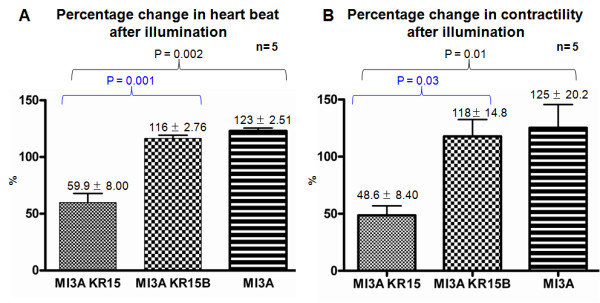
Cardiac output is consistently reduced in all illuminated SqKR15 larvae. (A-B) A bar chart comparing the percentage change in heartbeat (A) and contractility (B) after illumination of SqKR15/ET33-mi3A (sample) and controls (SqKR15B/ET33-mi3A; SqET33-mi3A) across three illuminated groups of five embryos each. Values presented are mean % change in heartbeat ± SEM (A) or mean % change in contractility ± SEM (B), where 100% indicates no change in heart beat or contractility after illumination. Paired T test between illuminated SqKR15 larvae and controls showed that the difference in value is significant (P < 0.05). P values between groups are highlighted by the enclosing brackets.