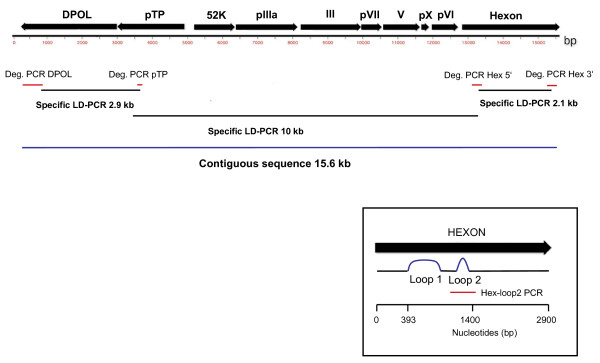
Figure 1.
PCR amplification strategy. Above the ruler, the amplified part of the AdV genome is depicted. Below, a schematic visualisation of the positions of the degenerated consensus PCRs (red lines), the long-distance PCRs (black lines) and the resulting contiguous sequence (blue line) is given. In the box, the hexon gene is magnified, and the positions of the hexon loops and the Hex-loop2 PCR (red line) are illustrated.

