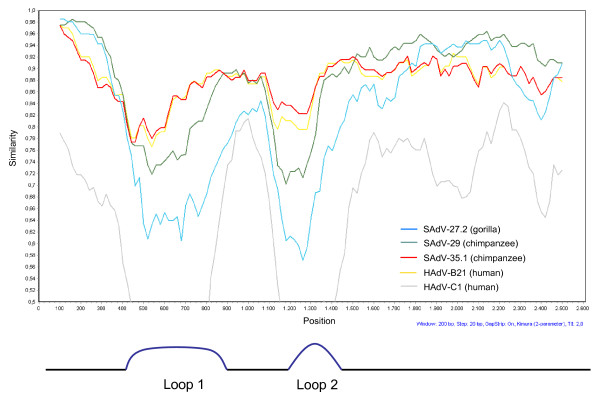
Figure 2.
Simplot analysis of the hexon gene. 2.8 kb of the GgorAdV-B7 hexon gene were compared to the hexon genes of selected chimpanzee (green and red line), gorilla (blue line) and human (yellow and grey line) AdVs. Below the plot, the analysis parameters are listed in blue font. The hexon Loop 1 and Loop 2 regions are indicated at the bottom.

