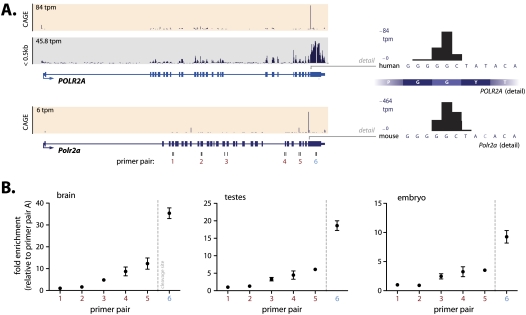
Figure 4.
Detailed analysis of Polr2a cleavage. (A) Genome Browser view showing human (top panel) and mouse (bottom panel) Polr2a gene. Frequency distribution of CAGE tags (beige panels) indicates prevalent cleavage in the terminal Polr2a exon in both human and mouse (note that promoter CAGE tags are omitted). Nucleotide-level resolution of the Polr2a cleavage site (right panels) indicates conservation of the cleavage event between human and mouse. Size-fractionated RNA sequencing tags from human embryonic stem cells (gray panel) shows enriched expression immediately downstream from the cleavage event. (B) RT-PCR using primer pairs in mouse brain, testes, and embryo shows enriched expression downstream from the cleavage site. Positions of the RT-PCR primers (1–6) are indicated in A.

