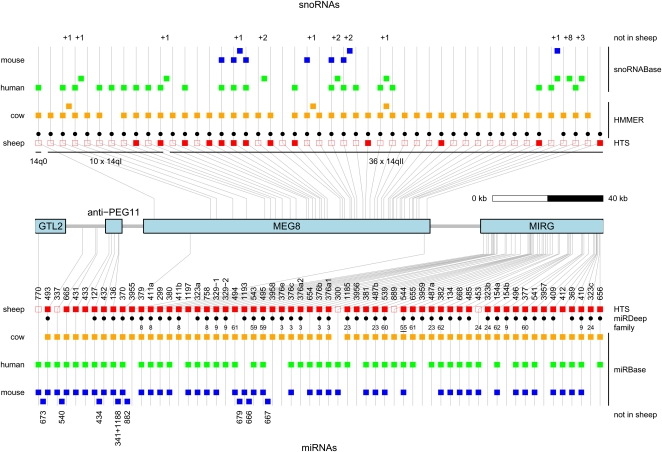
Figure 1.
Comparative map of the small RNA genes in the DLK1–GTL2 domain: snoRNAs (upper panel) and miRNAs (lower panel). Square boxes correspond to small RNAs detected in sheep (red), cow (orange), human (green), and mouse (blue). Gray lines connect orthologs in the four species and indicate their chromosomal position with respect to the four long noncoding RNA genes in the domain: GTL2, anti-PEG11, MEG8, and MIRG. The position of precursors not detected in sheep is indicated by squares nested between vertical gray lines. The numbers above and below snoRNA and miRNA columns, respectively, correspond to numbers of additional paralogs for the snoRNAs (from +1 to +8) and names of additional miRNAs. The red squares are filled when reads for the corresponding small RNA were found in the conducted HTS experiments, empty when not. (Black dots) miRNAs predicted by miRDeep (Friedlander et al. 2008) in sheep. Numbers below the black dots identify the cluster/family to which the corresponding miRNA was assigned using the BLAST/MCL algorithm (Enright et al. 2002). The family number of miR-544 is underlined as the other members map outside of the DLK1–GTL2 domain. (Black dots) snoRNAs predicted by HMMER (Durbin et al. 1998) in sheep. snoRNAs in mouse and human correspond to predictions made by Cavaille et al. (2002). snoRNAs in the cow were predicted by HMMER (Durbin et al. 1998). miRNAs in cow, human, and mouse were extracted from miRBase (Griffiths-Jones 2006).

