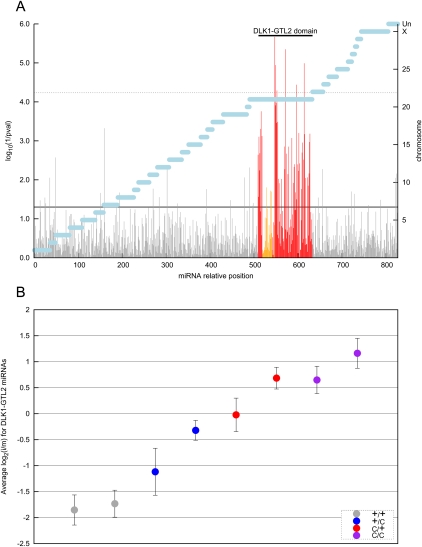
Figure 2.
(A) Log10(1/p) values of the effect of CLPG genotype on the expression level of 851 small RNAs in skeletal muscle of eight 8-wk-old sheep. Expression levels were estimated from the number of Illumina GA reads from two independent HTS experiments. The statistical significance of the CLPG effect was estimated by ANOVA. Gray vertical bars correspond to miRNAs outside of the DLK1–GTL2 domain, red vertical bars to miRNAs from the DLK1–GTL2 domain, and orange vertical bars to small RNAs derived from C/D snoRNA precursors. Horizontal black lines correspond to the nominal (plain line) and Bonferroni-adjusted (dotted line) 5% significance thresholds. Horizontal blue bars mark the different chromosomes (right Y-axis). (UN) Unassigned sequence contigs. (B) Average expression level, relative to the mean expression level of seven individuals sequenced twice (HTS1 and HTS2), of 99 “regular” miRNAs (i.e., excluding small RNAs derived from C/D snoRNAs) from the DLK1–GTL2 domain in skeletal muscle of eight sheep sorted by CLPG genotype (gray: +/+; blue: +Mat/CLPGPat; red: CLPGMat/+Pat; purple: CLPG/CLPG). Error bars correspond to 1.96 × the standard error of the estimate.

