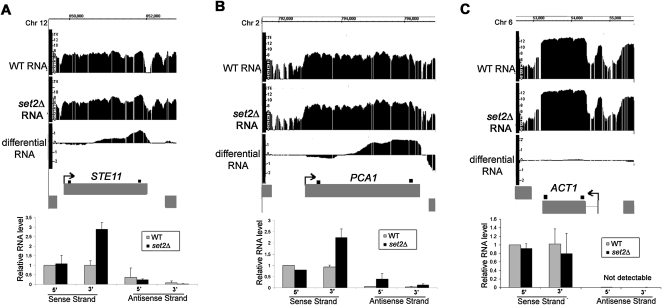
Figure 2.
Confirmation of RNA length changes in set2Δ cells. (A–C) Integrated Genome Browser screenshots of log2 WT, set2Δ, and differential RNA levels (set2Δ/WT) for STE11, PCA1, and ACT1 genes. Bar graphs, relative RNA levels (arbitrary units) quantified by real-time PCR using sense- and antisense-specific 5′ and 3′ primer sets for each gene (shown as small black boxes above each gene). Average values are shown ±SE obtained by analysis of two independent RNA samples for each strain. Cryptic initiation was detected in STE11 and PCA1, whereas there was no significant change in ACT1 expression.

