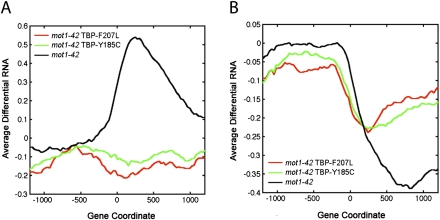
Figure 6.
Suppression of the premature termination defects in mot1 cells by mutations in TBP. (A,B) Profiles of average differential RNA—defined as the average of the differential RNA signal as determined in Supplemental Methods (RNA Tiling Array Data)—for genes showing premature termination length changes in mot1-42 versus WT cells (black lines). The x-axis indicates the position along the chromosome in base pairs relative to the start of the gene annotation (zero). For comparison, the plots show the average differential RNA profiles for these same genes in mot1-42 cells harboring TBP-F207L versus WT (red lines) and mot1-42 TBP-Y185C versus WT (green lines). Premature termination length effects were subclassified depending on whether the differential signal was positive (A, 77 genes) or negative (B, 264 genes). Average signals were obtained by smoothing over a 30-bp window.

