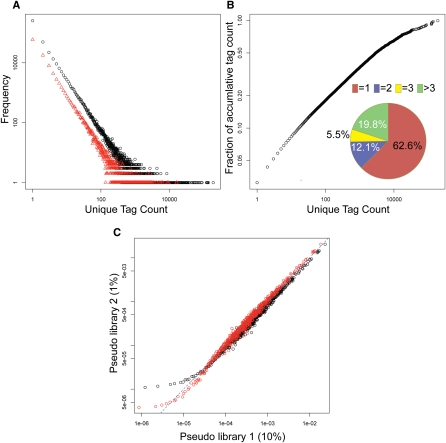
Figure 2.
Frequency plot of unique tag count and nonparametric empirical Bayes method. (A) Frequency of unique tag counts in libraries N1 (black) and N5 (red). X-axis is the observed tag count and y-axis is the frequency that shows the number of unique tags with a specific count. (B) Pie chart depicting the distribution of unique tags in library N1: 62.6% of unique tags has tag count 1, 12.1%, count 2, 5.5%, count 3, and 19.8% counts larger than 3. The outer plot shows the accumulative fraction of unique tag counts. Although 62.6% unique tags have count 1, they only account for 3% of total tag counts. (C) Scatter plot of tag proportion. X-axis is the proportion of tags in pseudo library 1 obtained by randomly sampling 10% of library N1. Y-axis is the average proportion of pseudo library 2 obtained by randomly sampling 1% of library N1. The data points are obtained in the following way. For example, find all of the tags in pseudo library 1 with proportion 1 × 10⁻⁶, then calculate the mean proportion of these tags in pseudo library 2, which gives for example 1 × 10⁻⁵. This gives a data point at (1 × 10⁻⁶, 1 × 10⁻⁵). The dashed line is y = x. Black symbols indicate the proportion using the maximum likelihood estimator, where overestimation in the low and intermediately expressed tags (<100/million) and underestimation in the highly expressed tags (>100/million) are observed. Red symbols mark the proportion calculated using nonparametric empirical Bayes method with improved, more comparable corrected proportions between two libraries with different sequencing depth in both low and highly abundant tags.

