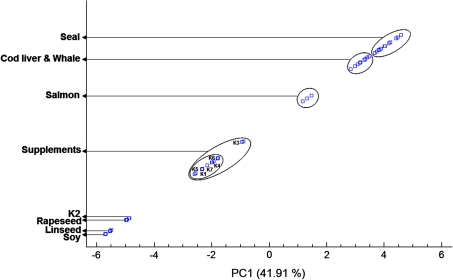
Fig. 1.
PC1 score plot for the different kinds of oils obtained after computing a 47 × 34 (samples × FAME profiles) data matrix. The different supplements and providers are designated by numbered letter Ks. For details regarding the providers see “Experimental”

