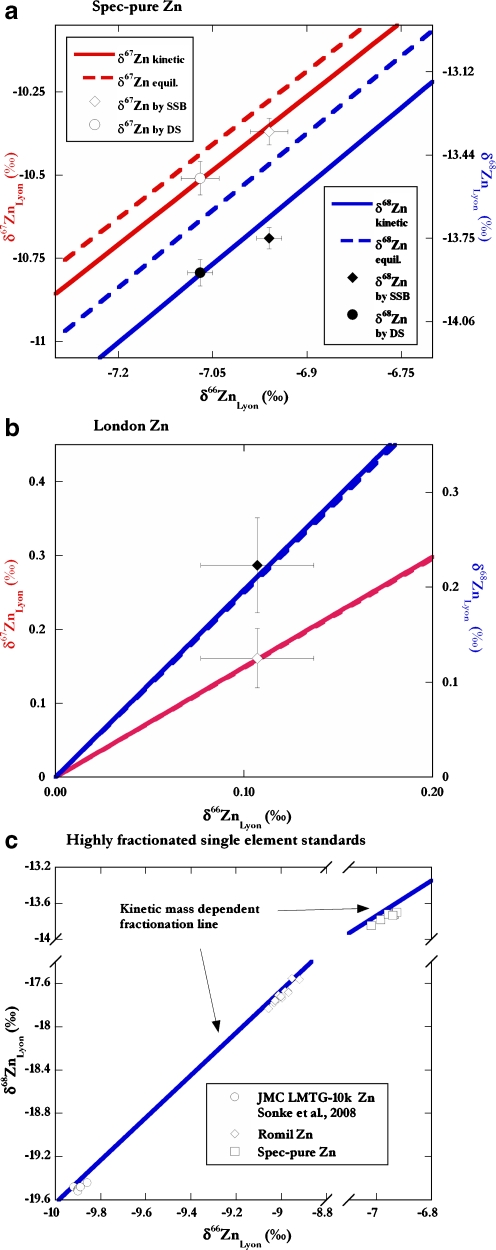
Fig. 4.
The Zn isotope compositions (open symbols for δ67Zn vs. δ66Zn; closed symbols for δ68Zn vs. δ66Zn) obtained by DS and by standard sample bracketing (SSB) for a Spec-pure Zn and b Lyon Zn. For Lyon Zn, only SSB results are shown for clarity (results by the DS methodology are shown in Table 3). The mean results of multiple analyses are shown. The error bars denote the ±2SE uncertainty limits (see text for details). Panel c presents a compilation of Zn isotope data from this study (Spec-pure), previous work on Romil Zn, and another pure Zn standard solutions with highly fractionated isotope compositions (JMC LMTG-10K Zn; Sonke et al. [40]). Note that the data of all three Zn standards appear to plot below the kinetic isotope fractionation line. The kinetic and equilibrium fractionation curves were calculated with Eq. 5 using β = 1.490 (kinetic) and 1.479 (equilibrium) for δ67Zn vs. δ66Zn and β = 1.971 (kinetic) and 1.942 (equilibrium) for δ68Zn vs. δ66Zn

