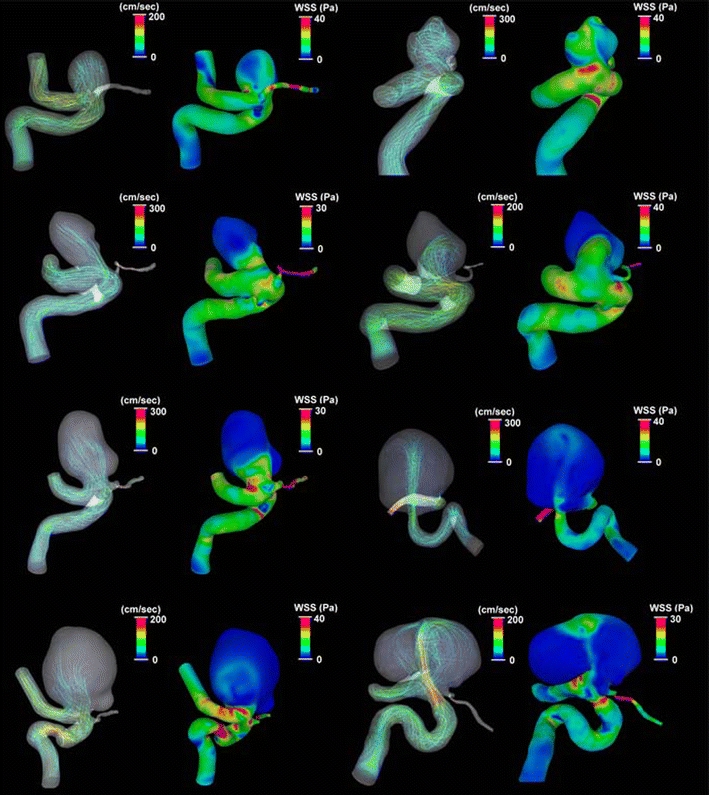
Fig. 2.

The general characteristics of the hemodynamics patterns in eight ICA–Oph aneurysms. Blood flow stream line and WSS during peak systolic phase are presented in each ICA–Oph aneurysm. In the stream line pictures, a red color line indicates faster flow, and a blue one means slower flow. In the WSS distribution pictures, area in red color indicates higher WSS, and area in blue means lower WSS
