Figure 3.

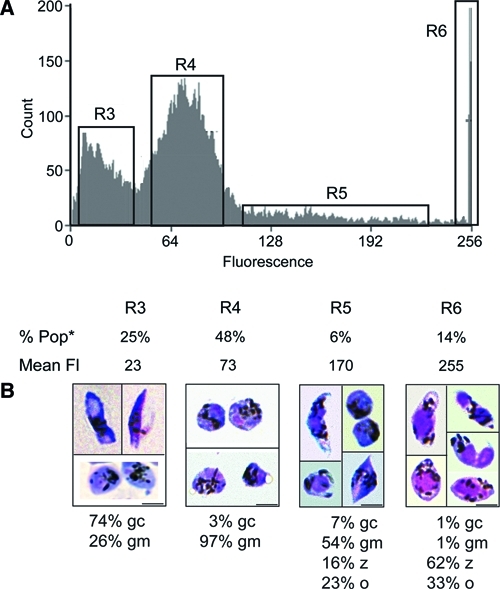
Flow cytometry sorting of P. falciparum sexual stage parasites, zygotes, and ookinetes based on DNA content. Flow cytometry-sorted samples were stained and analyzed by light microscopy to determine the dominant sexual stage form in each of the fluorescent regions populations identified by fluorescence intensity. (A) Vybrant Dyecycle Green-stained sexual stage parasites were analyzed by flow cytometry. Parasites showed differential fluorescence patterns divided into regions R3, R4, R5, and R6 based on fluorescence intensity. R3 and R4 constituted distinct fluorescent peaks. Percent of cells (% Pop) and mean fluorescence (Mean Fl) for each region are shown (*7% of the total cells counted are not contained within the four labeled gates shown and thus, could not be included in % Pop). (B) Sorted parasites from each population were stained with Leukostat and examined under light microscopy for quantification of parasite forms; 300–1,000 parasites were counted per sorted population. Gametocytes (gc) were the dominant form found in region R3; non–self-adherent round forms (gm) were found in region R4. Region R6 contained ookinetes (o) and round forms and likely contained retort ookinetes and zygotes (z), which expressed four times the fluorescence as regions R3 and R4 and represent gametocytes and likely, macrogametes. Less than 1% of parasite forms sorted into R3, and R4 was asexual stage parasite forms; 3–5% of all parasites sorted in R6 were asexual forms, mostly schizonts. (Scale bars: 5 μm.)
