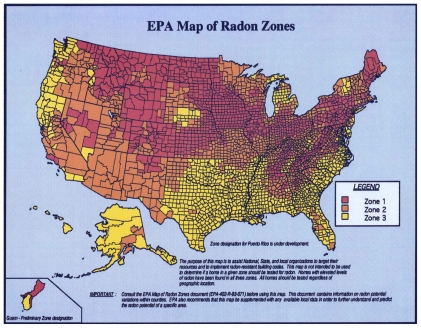
FIGURE 4.
Radon map for U.S. provided by EPA (EPA, 2009). Yellow areas in low elevation region is the lower radon area while the orange-ish colored area in Texas, in the northwest part of the state is the higher radon area.
Color legend: Dark red = > 4 pCi/L; Orange = Between 2 and 4 pCi/L; Yellow = < 2 pCi/L.

