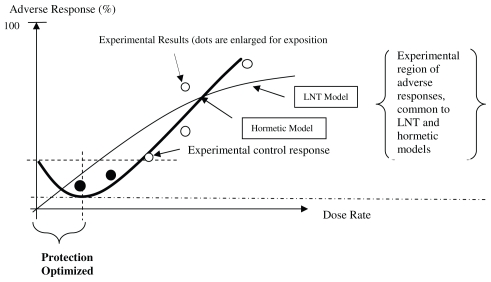
FIGURE 1.
Biphasic (hormetic) Dose-response Model for Cancer Incidence the percent response in the controls must be non-zero). Protection is “optimized” because it is greatest at a dose range furthest away from a non-zero percentage response in the controls. The black dots identify exposure-response points that are – or should be – included in any complete analysis otherwise the empirical relationship based on the white dots) cannot be falsified.

