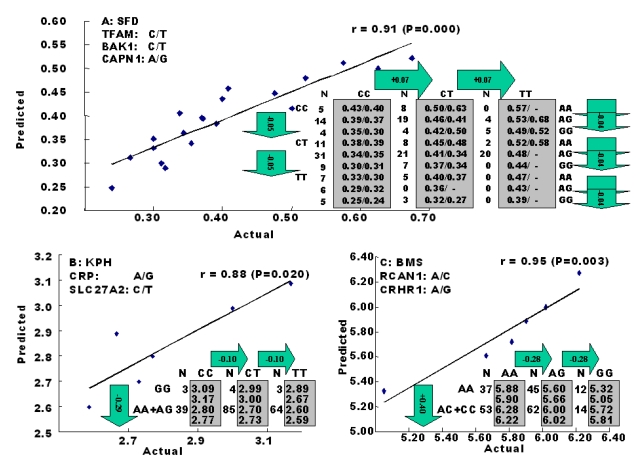
Figure 2.
Genetic networks for SFD (A), KPH (B) and BMS (C) by the linear regression analysis for all significant single gene-trait associations. The numbers in arrows represent substitution effects of one type of genotypes or allele for another one. Each combined genotype(s) among different genes has two means of performance: predicted (top or left side) and actual (bottom or right side). “-“ indicates that no animals were identified with the combined genotype(s) in the population 49.

