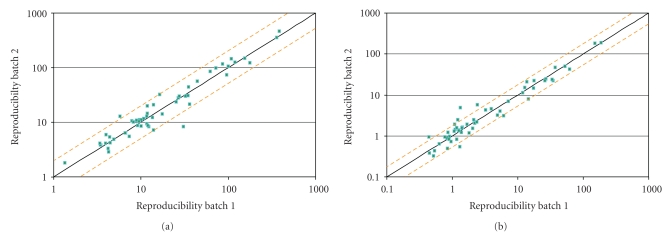
Figure 5.
Reproducibility of the H2T and the H2D assay. Run 1 and run 2 represent a combination of 45 breast cancer tumors and 11 cancer cell lines assayed in two different batches. The batches were run to incorporate the following comparisons: separation by 10 days, multiple illuminators, chiller blocks, pressure cookers, and capillary electrophoresis instrument, two runs with separate lots of critical control slide reagents and critical liquid reagents. Pairwise comparisons were made on each of the separate runs. For the H2T assay 2 separate runs (a) were performed. For the H2D assay 3 separate runs were performed; results from a typical pairwise comparison are shown in (b).

