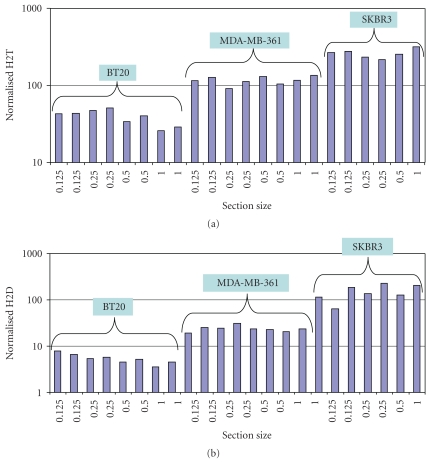
Figure 7.
Section size linearity of the H2T and H2D assays. (a) Cell line controls with varying levels of H2T (a) and H2D (b) were sub-sectioned and then run in the HERmark assay to determine linearity of the measurements with respect to section size. Normalized values (y-axis) show the final signals that have been corrected for size. 95.8% of the pairwise comparisons were within 1.7-fold in the H2T assay and 95% of the pairwise comparisons were with 2.2-fold for the H2D assay.

