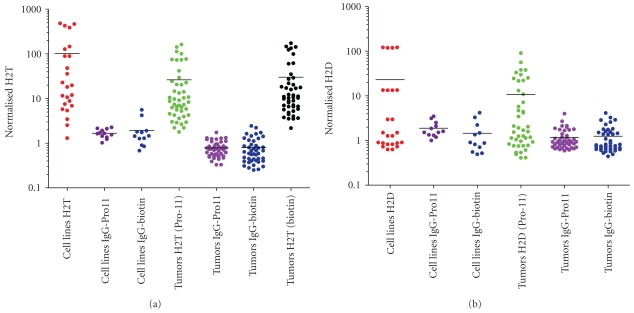
Figure 8.
Isotype control specificity of H2T and H2D assays. All 44 tumors and 11 cell lines were tested in the regular H2T assay. Slide samples from adjacent sections were also run in an H2T assay where the anti-HER2-pro11 antibody conjugate was replaced with an IgG1-pro11 conjugate (“IgG1-pro11”) or where the anti-HER2-biotin antibody conjugate was replaced with an IgG1-biotin conjugate (“IgG1-biotin”). (a) is a graphical representation of the non-specific contribution of signal in the H2T assay whereas (b) represents the non-specific contribution of the signal in the H2D assay.

