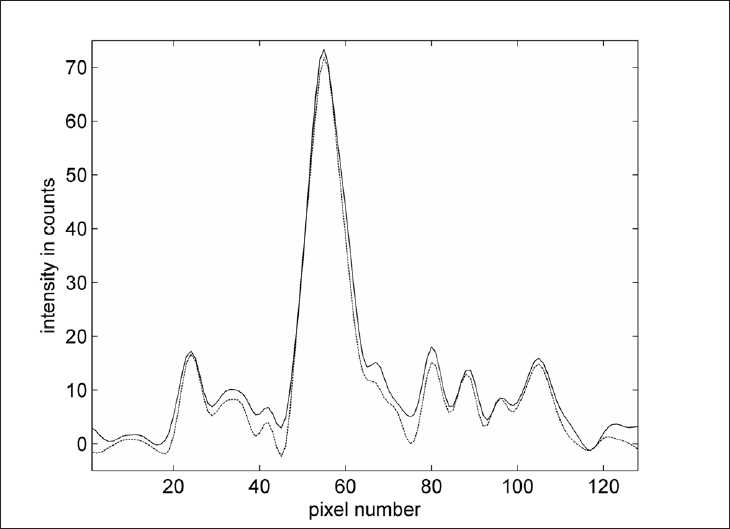
Figure 7.

Intensity profile from front to the back of the head through the maximum of the left striatum of subject 3 [Figure 3]. The solid line is without downscatter correction, and the dashed line is with downscatter correction. Maximum intensities are similar, but the intensities are lower in the brain regions outside the striatum and close to zero outside the head.
