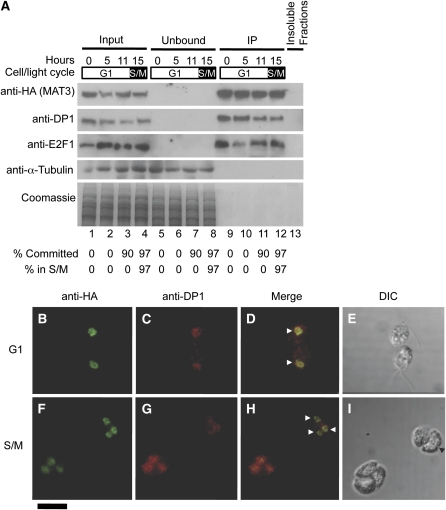
Figure 5.
MAT3/RB-DP1-E2F1 Relative Levels Are Constant, and the Proteins Remain Nuclear Localized throughout the Cell Cycle.
(A) Immunoblot detection of HA-MAT3, DP1, E2F1, and α-tubulin (top) and Coomassie staining of equivalently loaded gel run in parallel (bottom) from anti-HA immunoprecipitation of mat3-4::3XHA-MAT3 lysates. Cell cycle times from a 14 h:10 h light-dark synchronized culture are shown above each lane. Synchrony was determined from Commitment and mitotic index (S/M) assays shown for each fraction at the bottom. Equal total protein from each stage was used for the inputs. Lanes 1 to 4, 10% total input; lanes 5 to 8, 10% unbound fraction from IP; lanes 9 to 12, 10% IP pellet; lane 13, 10% of combined insoluble debris from all four lysates used for IPs.
(B) to (I) Immunofluorescence detection of 3XHA-MAT3 and DP1 during the cell cycle. G1 phase ([B] to [E]) or S/M phase ([F] to [I]) mat3-4::3XHA-MAT3 cells double-labeled with anti-HA (green signal; [B] and [F]) and anti-DP1 antibodies (red signal; [C] and [G]). (D) and (H) are merged signals from (B) and (C), and (F) and (G), respectively. The horizontal arrowheads mark examples of nuclei. (E) and (I) are differential interference contrast (DIC) images of cells from (B) to (D) and (F) to (I), respectively. The black arrowhead marks an incipient cleavage furrow in (I). Bar in bottom left corner = 10 μm.

