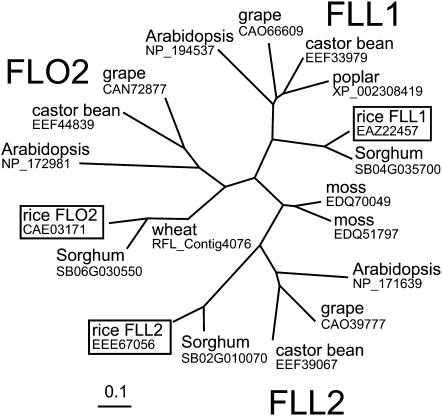
Figure 6.
Phylogenetic Tree of the Representative FLO2 Homologs.
Proteins are shown in the figure as the names of plant species with the corresponding accession numbers registered in protein databases (http://www.ncbi.nlm.nih.gov/ and http://www.ddbj.nig.ac.jp/index-j.html). Subfamilies including FLO2, FLL1, and FLL2 are indicated. Rice genes are boxed. Scale represents the number of differences between sequences.

