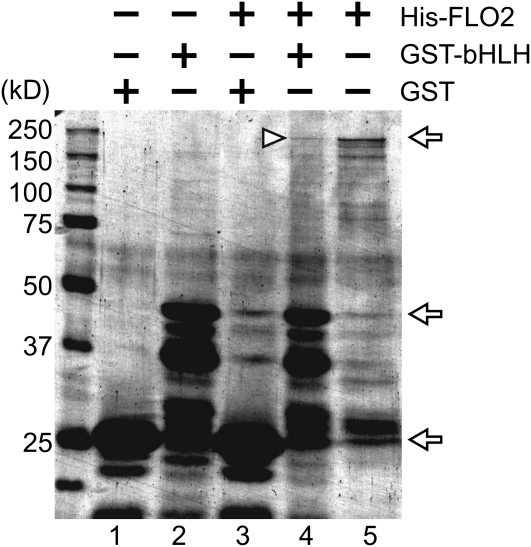
Figure 8.
Detection of the FLO2–bHLH Interaction by an in Vitro Pull-Down Experiment.
Proteins on SDS-PAGE were detected by Coomassie blue staining. Lanes 1 to 5 indicate GST, GST-fused bHLH, 6xHis tagged FLO2 pulled down with GST, 6xHis tagged FLO2 pulled down with GST-fused bHLH, and 6xHis-tagged FLO2 without GST-fused bHLH, respectively. Arrows indicate the size of 6xHis-tagged FLO2 (215 kD), GST-fused bHLH (48 kD), and GST (25 kD). The triangle indicates the predicted position of the 6xHis-tagged FLO2 bound with GST-fused bHLH. Size markers and their molecular sizes are shown on the left.

