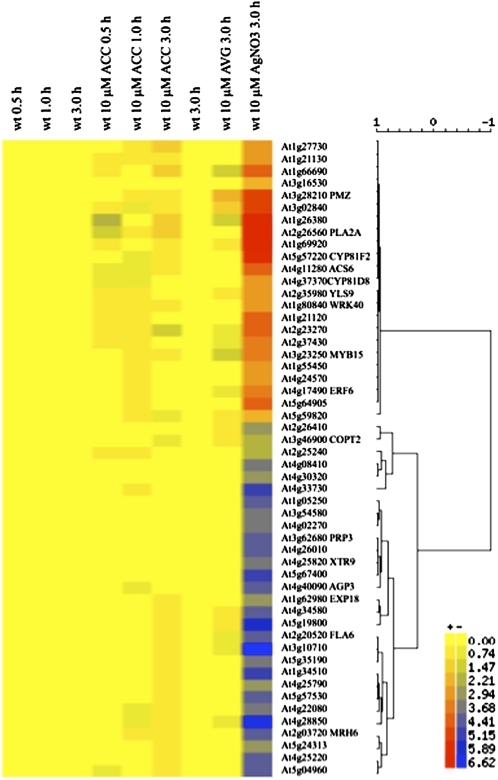
Figure 7.
Graphic Display of Hierarchical Cluster Analysis of cys-c1 Downregulated Genes in Seedlings Treated with Ethylene Inhibitors or Precursors.
Hierarchical clustering analysis was applied to a set of 52 downregulated genes in the cys-c1 mutant, as well as ACC-, AVG-, and AgNO3-treated seedlings. Each column represents the time course and treatment samples indicated at its top, and each row refers to a gene. A dendrogram representing hierarchical relationships among treatments is shown, and the scale at the top marks the correlation coefficient represented by the length of the branches that connect pairs of nodes. The color scale indicates the log2 level of expression above (red) or below (blue) the median. The data sets of the ACC time course and of the ethylene inhibitor treatments are from the AtGenExpress Consortium, NASCarray experiment reference numbers 172 and 188, respectively.

