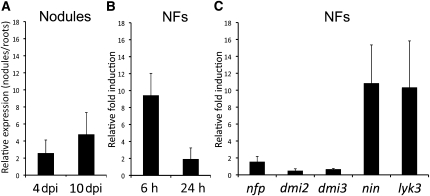
Figure 4.
Quantification of PUB1 Expression upon Rhizobia Inoculation and NF Treatment Using qRT-PCR.
Each bar represents the average of values from three independent biological replicates normalized using two reference genes. Standard deviation between biological replicates is represented.
(A) PUB1 is induced in nodules at 4 and 10 DAI (dpi) compared with noninoculated roots.
(B) PUB1 is induced after 6 and 24 h of NF versus water treatment.
(C) PUB1 is not induced after 6 h of NF versus water treatment in nfp, dmi2, and dmi3 mutants but is still induced in nin and lyk3 mutants.

