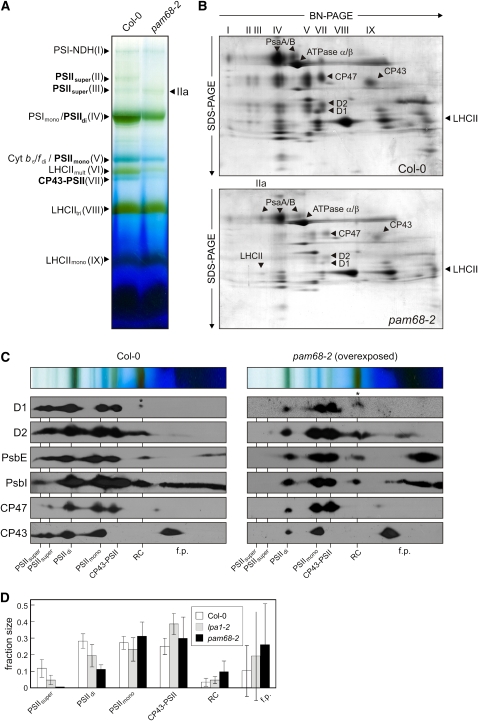
Figure 4.
Accumulation of PSII Assembly Complexes under Steady State Conditions.
(A) BN-PAGE analysis of thylakoid multiprotein complexes. Thylakoids were isolated from equal amounts of fresh leaf material (100 mg) obtained from wild-type (Col-0) and mutant (pam68-2) plants and solubilized with 1.5% (w/v) β-DM. The extracts were then fractionated by BN-PAGE. The bands detected were identified with specific protein complexes in accordance with previously published profiles (Granvogl et al., 2006; Schwenkert et al., 2006; Peng et al., 2008): PSI-NDH supercomplex (PSI-NDH; band I), PSII supercomplexes (PSIIsuper; bands II and III), PSI-LHCII complex (band IIa), PSI monomers and PSII dimers (PSImono and PSIIdi; band IV), PSII monomers and dimeric Cyt b6/f (PSIImono and Cyt b6/fdi; band V), multimeric LHCII (LHCIImult; band VI), CP43-free PSII monomers (CP43-PSII; band VII), trimeric LHCII (LHCIItri; band VIII), and monomeric LHCII (LHCIImono; band IX). PSII assembly complexes are highlighted in bold.
(B) 2D BN/SDS-PAGE separation of thylakoid protein complexes. Individual lanes from BN-PA gels as in (A) were analyzed in the presence of SDS by electrophoresis on 10 to 16% PA gradient gels, which were then stained with colloidal Coomassie blue (G 250). The identity of relevant proteins is indicated by arrows.
(C) Detection of PSII assembly complexes by immunoblot analyses of 2D BN/SDS gels as in (B) with antibodies against D1, D2, PsbE, PsbI, CP47, and CP43. The positions of PSII assembly complexes (PSIIsuper, PSII supercomplexes; PSIIdi, PSII dimers; PSIImono, PSII monomers; CP43-PSII, CP43-free PSII monomers; RC, reaction center-like complex) and free proteins (f.p.) are indicated. Signals were obtained by chemiluminescence. Exposure times were ~2 min (wild type) and ~10 min (mutant). Accumulation of pD1 is indicated by asterisks.
(D) Signals obtained for D1, D2, PsbE, PsbI, CP43, and CP47 in (C), and for the same proteins from the lpa1-2 mutant (see Supplemental Figure 1 online), were quantified for each PSII assembly complex and for free proteins. The relative amounts of all PSII assembly complexes were calculated for each protein (summing to 1 for each protein), and mean values and standard deviations for each PSII assembly complex were determined from three replicates. Note that Ler, the genetic background of lpa1-2, behaved similar to Col-0.

