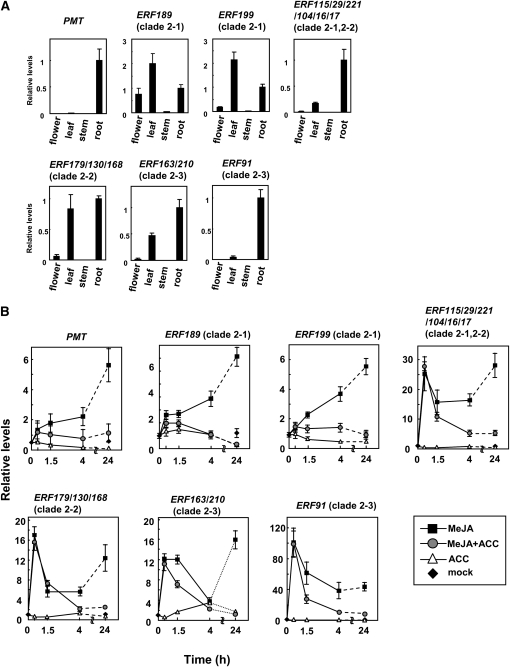
Figure 10.
Expression Patterns of Clade 2 ERF Genes.
Transcript levels were analyzed by qRT-PCR. The error bars indicate the sd for three biological replicates. Expression patterns of PMT are also shown as references.
(A) Organ-specific expression. Expression levels in the flower, leaf, and stem of wild-type tobacco plants are shown relative to levels in the root.
(B) Responses to MeJA and ACC. Wild-type tobacco hairy roots were treated with 100 μM MeJA (black square), 100 μM ACC (white triangle), or both (gray circle) for 0.5, 1.5, 4, and 24 h. Transcript levels of mock-treated samples (black diamonds) are shown at 0 and 24 h. All values are relative to the transcript levels at 0 h.

