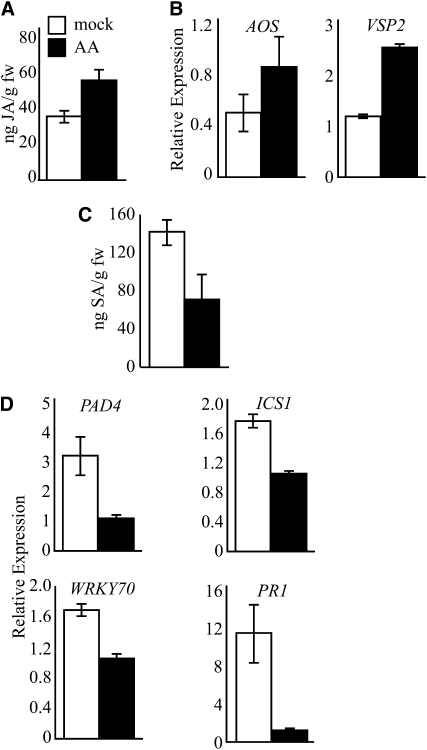
Figure 4.
AA Coordinates Events Underlying Alteration in Expression of JA and SA Pathway Genes and Metabolites.
Measurements were performed on leaves exogenously treated with 10 μM AA (black bars) or mock treated with 0.02% ethanol (white bars).
(A) and (C) Measurements of JA and SA metabolite levels in AA- and mock-treated plants.
(B) and (D) Total RNA was extracted from AA- or mock-treated 4-week-old rosette leaves and subjected to real-time quantitative PCR analysis. The transcript levels of each gene, AOS, VSP2, PAD4, ICS1, WRKY70, and PR1, were normalized to At4g34270 (T1P41-like family protein) and At4g26410 (M3E9) measured in the same samples. Data are means of three biological replicates ± se.

