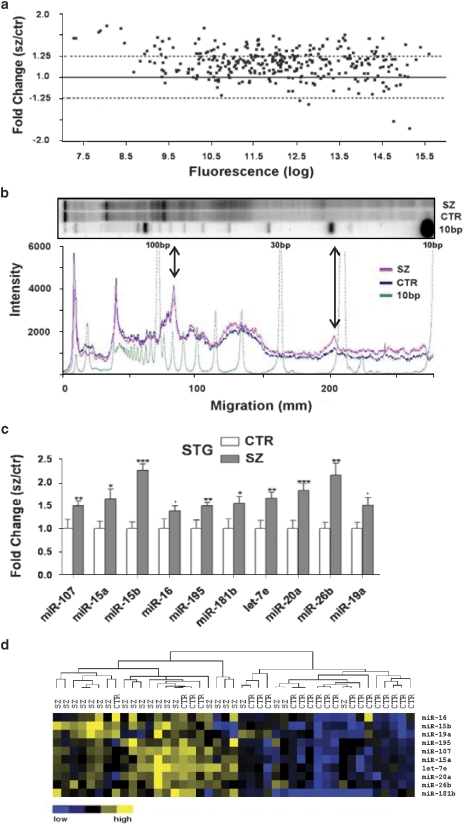
Figure 1.
Schizophrenia-associated miRNA expression in the superior temporal gyrus (STG). (a) Average fold change of miRNA expression (schizophrenia to control) was plotted against log2-transformed fluorescence values (n=17 matched pairs). A global increase in miRNA expression in the STG in schizophrenia is indicated by the majority of miRNA showing a ratio >1.0. (b) Electrophoresis of dephosphorylated total RNA (pooled samples) labeled with polynucleotide kinase (PNK). Whole lane densitometry of the phosphor image indicated an increase in small RNA in the schizophrenia cohort (pink trace) compared with the controls (blue trace), particularly in the small RNA fraction (20–24 nt) region corresponding to most miRNAs (indicated by long arrow). Densitometry was normalized to the ∼75-nt band in each lane (indicated by short arrow). (c) Increased miRNA expression in the STG was validated using quantitative real-time reverse transcription-PCR (Q-PCR) (n=21 matched pairs). Level of expression for controls was set at 1. Bars are mean+s.e.m. *P<0.05; **P<0.01; ***P<0.001;+miR-16 and miR-19a were significant by t-test but were found to correlate with pH (r=−0.459 and −0.443, respectively) and fell short of significance by analysis of covariance. (d) Q-PCR expression data hierarchically clustered (correlation uncentered, average linkage; Cluster 3.0). Blue indicates low expression and yellow indicates high expression (Java Treeview; http://www.sourceforge.net/projects/jtreeview/files).

