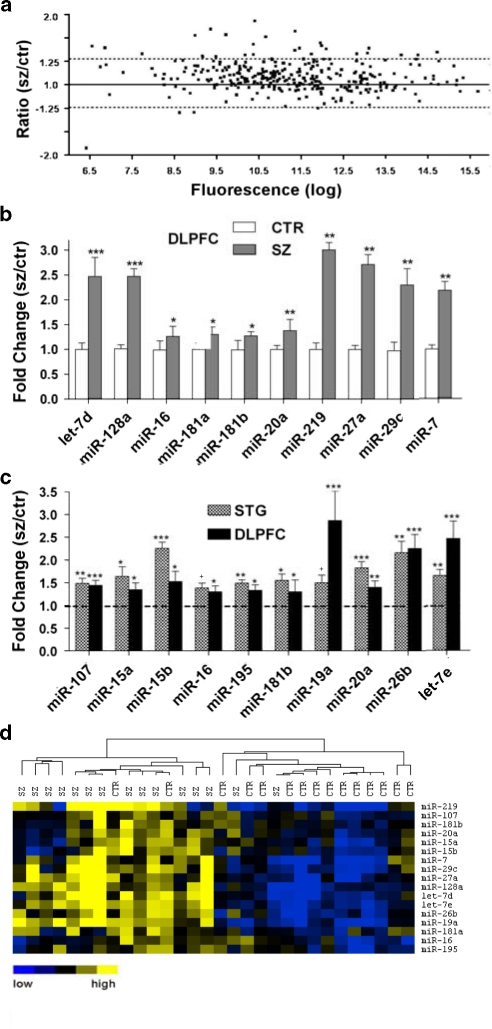
Figure 2.
Schizophrenia-associated miRNA expression in the dorsolateral prefrontal cortex (DLPFC). (a) miRNA expression in the DLPFC in schizophrenia was characterized by the global upregulation illustrated in this scatter plot (see Figure 1a for description), with the majority of individual miRNAs showing a ratio >1.0. (b) Increased miRNA expression in the DLPFC was validated using quantitative real-time reverse transcription-PCR (Q-PCR) (n=15 matched pairs). Level of expression for controls was set at 1. (c) Further Q-PCR expression analysis indicated that 11 miRNAs with altered expression showed an upregulation in both the superior temporal gyrus and DLPFC. Bars indicate mean fold change+s.e.m. *P<0.05; **P<0.01; ***P<0.001. (d) Q-PCR expression data were subjected to hierarchical clustering and heat map, shown as described in Figure 1d.

