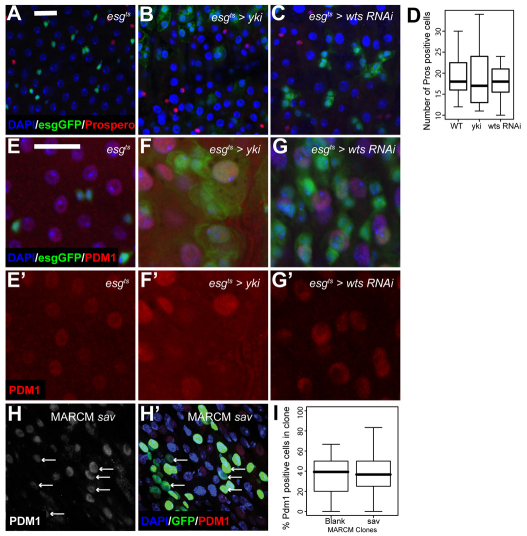
Fig. 2.
Hpo pathway inactivation does not prevent differentiation. (A-C) esgts-driven expression of Yki (B) or wts-RNAi (C) does not alter ee cell number compared with control (A). Nuclei are stained with DAPI (blue) in all panels; esg+ cells are marked by GFP (green) and Pros is red. (D) Pros+ cell number in the indicated genotypes (n>15). (E-G′) esgts-driven expression of Yki (F,F′) or wts-RNAi (G,G′) increases EC nuclear size compared with control (E,E′). esg+ cells are marked by GFP (green) and Pdm1 marked ECs are red. (H,H′) Daughter cell differentiation to Pdm1+ ECs in sav MARCM clones after 2 weeks of clone growth (arrows). Mutant clones are marked by GFP (green) and Pdm1 is red. Scale bar: 20 μm. (I) Percentage of Pdm1+ cells per clone in 1-week-old savshrp1 mutant MARCM clones compared with neutral MARCM clones.

