Fig. 7.
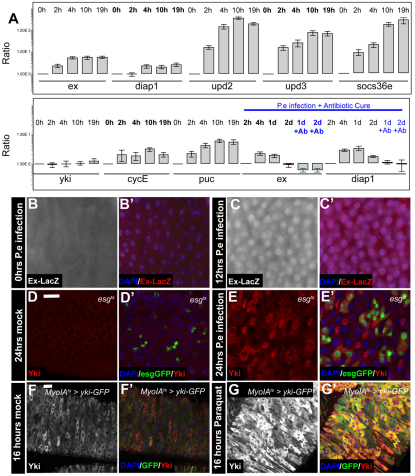
Intestinal stress results in increased Yki levels and induction of Hpo pathway targets. (A) RT-qPCR shows Yki target induction (expanded, diap1) immediately upon P.e infection (top panel) and reversal of Yki target mRNA abundance following antibiotic treatment (bottom panel). (B-C′) Increased ex-LacZ activity following 12 hours of P.e infection (C,C′) compared with mock-infected guts (B,B′). Nuclei are stained with DAPI (blue), β-galactosidase is red. (D-E′) Twenty-four hour P.e infection leads to increased Yki levels in esg+ progenitors and ECs (E-E′) compared with mock-infected guts (D,D′). esg+ cells are marked by GFP (green), Yki is red. (F-G′) Increased Yki levels following treatment for 16 hours with paraquat (G,G′) compared with non stressed gut (F,F′). GFP is green and Yki is red. Scale bars: 20 μm.

