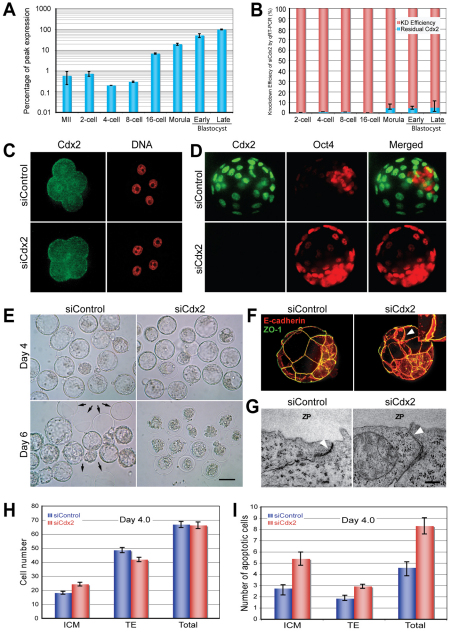
Fig. 1.
Efficient reduction of Cdx2 mRNA and protein levels in different preimplantation stage mouse embryos by siCdx2 results in phenotypes similar to Cdx2 knockout. (A) Relative Cdx2 mRNA expression levels as a percentage of peak expression in mouse embryos at different preimplantation stages, as assessed by qRT-PCR. The maternal mRNA decreased at the 4-cell stage, followed by upregulation at the 8-cell stage due to the zygotic activation of Cdx2. Embryo collection times (post-hCG): 2-cell stage, 40 hours; 4-cell stage, 52 hours; 8-cell stage, 62 hours; 16-cell stage, 72 hours; morula, 85 hours; early blastocyst, 96 hours; late blastocyst, 115 hours. (B) A comparison of Cdx2 mRNA levels in siControl- and siCdx2-treated zygotes at different preimplantation stages demonstrated robust downregulation of Cdx2 by siCdx2 treatment. KD, knockdown. (C) Confocal images of 8-cell stage embryos immunolabeled with anti-Cdx2 monoclonal antibody illustrate the reduction of Cdx2 protein (green) by siCdx2 treatment. Red, nuclear counterstaining with DRAQ5. (D) Confocal images of blastocyst stage embryos immunolabeled with anti-Cdx2 (green) and anti-Oct4 (red) antibodies. Following siCdx2 treatment, Cdx2 was eliminated, but Oct4 was ectopically expressed in the trophectoderm (TE). (E) DIC images of E4.0 and E6.0 embryos. All siCdx2-treated embryos failed to hatch. Arrows indicate empty zonae pellucidae left by hatched control embryos. Scale bar: 100 μm. (F) Confocal images of ZO-1 (green) and E-cadherin (red) immunohistochemistry show normal E-cadherin distribution, which marks the lateral-basal cell boundary, but disoriented cell polarity of the TE, as indicated by the presence of ZO-1 at both the apical and basal sides (arrowhead and inset). (G) Defective tight junction (arrowhead) in the TE of a Cdx2-deficient blastocyst as shown by electron microscopy. Scale bar: 0.2 μM. (H) Effect of Cdx2 depletion on TE and inner cell mass (ICM) cell numbers. The number of ICM cells was significantly increased (P<0.01), but the total cell number remained unchanged (P=0.64) upon Cdx2 depletion. (I) Quantitation of apoptotic cells shows an increase in apoptotic activity in a Cdx2-deficient E4.0 blastocyst,. MII, metaphase II oocyte; ZP, zona pellucida. Error bars indicate standard deviation.

