Fig. 4.
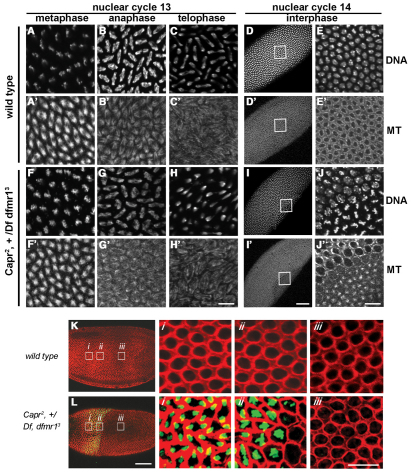
Mitosis appears normal in embryos with a disrupted MBT. (A-J′) Immunofluorescence analysis of Drosophila embryos laid by females of the indicated genotypes (left) during the indicated cell cycle phase (top), stained with TO-PRO-3 iodide (DNA, A-E,F-J) and with antibodies to α-Tubulin 67C to visualize microtubules (MT, A′-E′,F′-J′). The boxed regions of D, D′, I and I′ are enlarged as E, E′, J and J′, respectively. (K,L) Embryos of the indicated genotypes were imaged for F-actin (red) and phospho-Histone H3-Ser10, a marker for mitotic chromosomes (green). The boxed regions are enlarged as labeled (i-iii). The wild-type embryo (K) is in interphase of NC14, whereas a portion of the mutant embryo is in interphase of NC14 (iii) and another portion is undergoing precocious mitosis (i,ii). Scale bars: 50 μm in D,D′,I,I′,K,L; 10 μm in all other panels.

