
Figure 6.
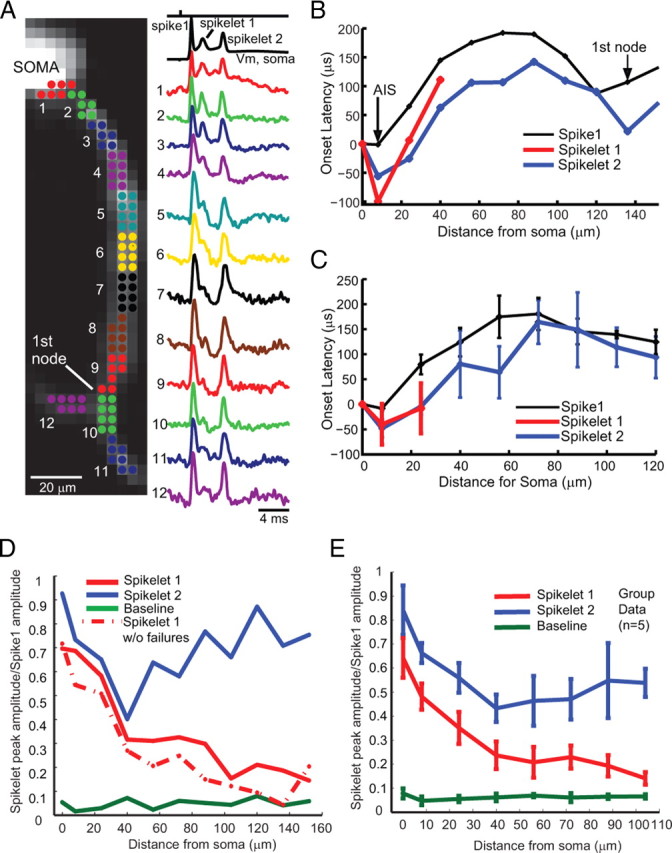
Action potentials show variable propagation probabilities during complex spikes. A, Voltage-sensitive dye fluorescence image of the soma–axon region in recording position shown on the left. Top trace on the right (black), Timing of climbing fiber activation by extracellular electrical stimulation. Second trace (black), Whole-cell somatic recording. Bottom color traces, Optical recordings of AP signals, evoked with climbing fiber stimulation, from 12 locations indicated on the image. Each trace is a temporal average of 18 trials and a spatial average of 6–8 pixels. Signals are scaled so that the first AP is of the same height. B, C, Action potential onset latency, measured from the time to half-maximum amplitude, as a function of distance from the edge of the soma for the first sodium spike (thin trace) and subsequent spikelets (red and blue traces) for a Purkinje cell (B) and average group data (C). In both cases, the first spikelet fails to propagate at 30–60 μm, before the first branch point. D, Relative amplitude (proportion of amplitude of the first and second spikelets) versus distance from the soma. Note that the first spikelet continuously decreases, whereas the second spikelet decreases and then increases in amplitude. The first spikelet amplitude was measured as the peak membrane potential at 0.5–3 ms after the first spike, whereas the second spikelet amplitude was measured as the peak membrane potential at 3–10 ms after the first spike (see Materials and Methods). The bottom data points represent baseline noise before initiation of a complex spike. The dashed line (spikelet 1 without failures) represents the average response after excluding two trials in which the first spikelet propagated successfully down the main axon. E, Group data (n = 5) demonstrating the general property of the first spikelet to decrease over the first 100 μm of the axon, whereas the amplitude of the second spikelet often decreases and then increases with distance from the soma, indicating active propagation. The bottom data points represent average baseline data points before spike initiation. The peak amplitude of each spikelet contains in part the underlying membrane potential change because of activation of either the previous spike or the slow depolarization of the complex spike (this is particularly true of sites near the soma). In all cells, the first spikelet decayed to 30% or less of its amplitude at initiation within 100 μm of the soma. All trials are included. See supplemental Figure 5 (available at www.jneurosci.org as supplemental material) for the point of spikelet failures for individual neurons. Error bars indicate SEM.