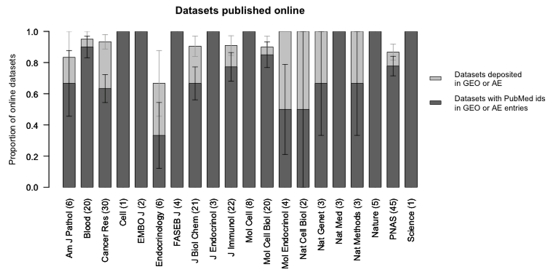
Figure 3.
Gene expression microarray datasets published online, by journal. Light grey bars represent the proportion of online datasets available in the Gene Expression Omnibus or ArrayExpress databases. Dark grey bars represent the proportion of online datasets that include their publication PubMed identifier in the GEO or ArrayExpress entry, and thus can be found by our retrieval method. The number of online datasets in our sample follows the journal title, in parentheses.

