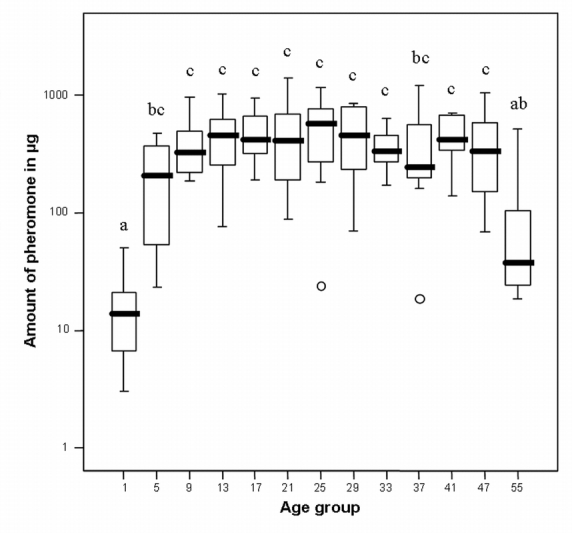
Figure 1.

Amount of cephalic gland content extracted from male beewolves of different ages. Bold lines represent medians, boxes comprise the interquartile range, and bars indicate minimum and maximum values, except extreme values, these are represented by circles. Quantities are given in μg on a log10-scale. The age groups contain exclusively or predominantly males of the designated age (in days) (exceptions see “Materials and methods” section). Different letters above boxes indicate significant differences between groups (p<0.05). Sample sizes of age groups (from left to right) are: 8, 8, 8, 8, 9, 8, 8, 7, 8, 7, 5, 10, and 11, respectively.
