Figure 2.

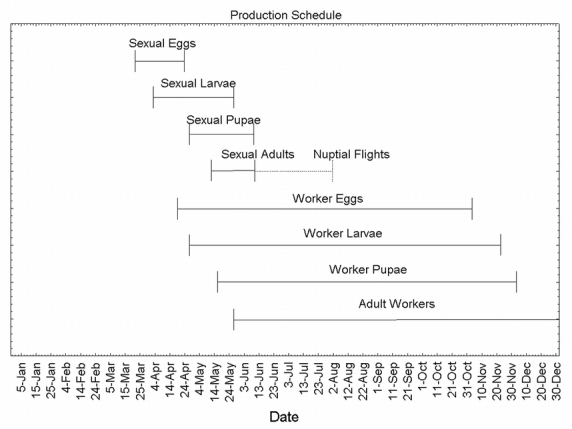
The production schedule of P. badius. Horizontal bars represent time when that developmental stage is predicted to be in the colony. The dashed line represents the approximate time span of nuptial flights.

The production schedule of P. badius. Horizontal bars represent time when that developmental stage is predicted to be in the colony. The dashed line represents the approximate time span of nuptial flights.