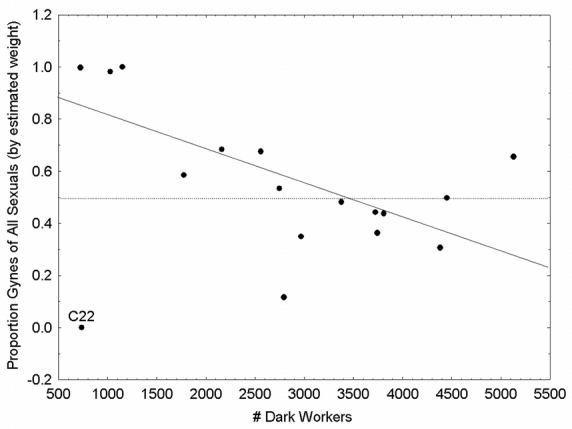
Figure 4.

Sexual allocation, expressed as the proportion invested into gynes (by estimated dry weight) against colony size (the number of mature workers). The dashed line represents equal investment in both sexes while the solid line is the fit from a linear regression excluding C22, statistically an outlier.
