
Figure 2.
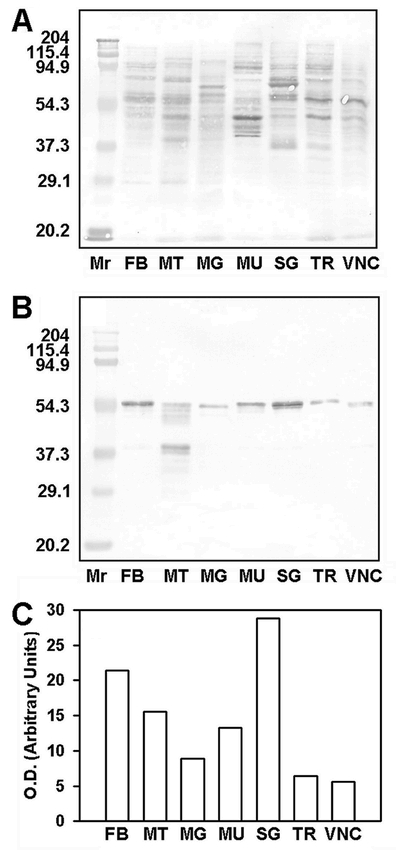
Western blot analysis of larval tissues from Spodoptera frugiperda fifth instars subjected to SDS-PAGE and transferred to PVDF membranes. (A) The membrane (5 μg of protein/lane) was stained with Coomassie Blue to visualize all proteins. Molecular mass markers (Mr) are expressed in kilodaltons. (B) The membrane (2 μg of protein/lane) was probed with 1 μg/ml Mab 7D6, followed by 1:4000 goat anti-mouse IgG-alkaline phosphatase conjugate and NBT/BCIP substrate, to visualize EF-1α. (C) Tissue concentrations of EF-1α shown in panel B were compared by reflectance densitometry. Relative optical densities (O.D.) are indicated by open bars. Tissue designations are as in Fig. 1.