Abstract
The sex pheromone of the scarab beetle, Phyllophaga anxia, is a blend of the methyl esters of two amino acids, L-valine and L-isoleucine. A field trapping study was conducted, deploying different blends of the two compounds at 59 locations in the United States and Canada. More than 57,000 males of 61 Phyllophaga species (Coleoptera: Scarabaeidae: Melolonthinae) were captured and identified. Three major findings included: (1) widespread use of the two compounds [of the 147 Phyllophaga (sensu stricto) species found in the United States and Canada, males of nearly 40% were captured]; (2) in most species intraspecific male response to the pheromone blends was stable between years and over geography; and (3) an unusual pheromone polymorphism was described from P. anxia. Populations at some locations were captured with L-valine methyl ester alone, whereas populations at other locations were captured with L-isoleucine methyl ester alone. At additional locations, the L-valine methyl ester-responding populations and the L-isoleucine methyl ester-responding populations were both present, producing a bimodal capture curve. In southeastern Massachusetts and in Rhode Island, in the United States, P. anxia males were captured with blends of L-valine methyl ester and L-isoleucine methyl ester.
Resumen
La feromona sexual del escarabajo, Phyllophaga anxia, es una mezcla de los ésteres metílicos de dos aminoácidos, L-valina y L-isoleucina. Se condujo un estudio de campo usando diferentes mezclas de los dos componentes en 59 sitios de Estados Unidos y Canada. Más de 57,000 machos de 61 especies de Phyllophaga fueron capturados e identificados. Tres de los resultados más importantes incluyen: (1) el extenso uso de los dos componentes [de las 147 especies de Phyllophaga (sensu stricto), en Estados Unidos y Canada, fueron capturados machos de cerca del 40% de ellas.]; (2) para la mayoría de las especies, la respuesta intraespecífica de los machos a las combinaciones de los dos aminoácidos fue consistente entre años diferentes, y en todos los sitios geográficos; y (3) un inusual polymorfismo de la feromona fue descrito para P. anxia. Poblaciones de algunos sitios fueron atrapados sólo con valina, mientras que poblaciones de otros sitios fueron atrapados sólo con isoleucina. También se encontraron sitios donde las poblaciones responden a ambos componentes, valina e isoleucina, produciendo una curva de captura bimodal. En el sureste del estado de Massachusetts y en Rhode Island, en Estados Unidos, machos de P. anxia fueron atrapados en trampas con mezclas de valina e isoleucina.
Introduction
The scarab beetle genus Phyllophaga (sensu lato) is one of the largest genera of animals in the United States (Woodruff and Beck 1989), encompassing 203 described species in 8 subgenera, including 147 species (and 8 subspecies) in the subgenus Phyllophaga (sensu stricto), 39 species in Listrochelus, 7 species in Phytalus, 3 species in Cnemarachis (all non-native and confined to south Florida), 3 species in Eugastra, 2 species in Tostegoptera, 1 species in Chlaenobia, and 1 species in Triodonyx (Evans 2003, Smith and Evans 2005). Their striking genitalic morphology, first described in the late 19th century (Smith 1888), continues to be the most important taxonomic character used to separate species in this group (Luginbill and Painter 1953). See Woodruff and Beck (1989) and Woodruff and Sanderson (2004) to view excellent scanning electron microscopy images of Phyllophaga genitalia.
The economic importance of this genus relates principally to the root feeding habits of the larvae, commonly called white grubs. Larvae of various species of Phyllophaga have been recorded feeding on crops that include, but are not limited to, nursery stock (Andre 1937), corn (Bessin 1999), commercial turfgrass (Brandenburg and Villani 1995; Vittum et al. 1999), cranberries (Dunn and Averill 1996; Eck 1990; Franklin 1950), sugarcane (Gordon and Anderson 1981), sweet potato (Hammond et al. 1997), and pasture (Luginbill and Painter 1953). True to the Greek origin of their generic name (Phyllo-leaf + phaga-eat), adult Phyllophaga in very large flights have been known to defoliate stands of trees. Although adults of some Phyllophaga species are apparently host specific, most are polyphagous (Luginbill and Painter 1953).
P. anxia (LeConte) is the most widely distributed Phyllophaga species in North America (Luginbill and Painter 1953; Woodruff and Beck 1989). Two genitalic morphs are described in this species, the northern form and the southern form (Luginbill and Painter 1953; Woodruff and Beck 1989). The first sex pheromone described from the genus Phyllophaga was identified from virgin P. anxia adults dug in mid-April from a cranberry bog in Carver, Massachusetts, before their May flight. The female-produced sex pheromone was determined to be a 75/25 blend of L-valine methyl ester and L-isoleucine methyl ester (Zhang et al. 1997). L-isoleucine methyl ester was first elucidated from Holotrichia parallela (Leal et al. 1992), an Asian melolonthine species. Holotrichia is regarded by some as being inseparable taxonomically from the Nearctic Phyllophaga (Saylor 1937; Saylor 1939).
L-valine methyl ester and L-isoleucine methyl ester are unusual pheromone compounds in that their precursors are the essential amino acids, L-valine and L-isoleucine. These essential amino acids are available only via sequestration from food plants fed on by the larvae, or perhaps from endo-symbionts. Our future investigations will hopefully determine the source of these amino acids. For the most recent overview of beetle semiochemicals see Francke and Dettner (2005).
Since P. anxia is a common species throughout the Northeast, the pheromone was deployed in the field near Geneva, New York, in 1996. P. anxia males were captured with this blend, as expected. However, another species of Phyllophaga, P. futilis, was also captured in the traps in much smaller numbers. Our interest was piqued by the P. futilis catches because sex pheromones are generally regarded as species-specific mate recognition signals, although studies have demonstrated varying degrees of pheromone specificity between closely related species (Roelofs 1978), as well as pheromone polymorphism in geographically separated conspecifics such as Agrotis segetum (Wu et al. 1999), Ostrinia nubilalis (Glover et al. 1991; Klun and Cooperators 1975), and Hemileuca eglanterina (McElfresh and Millar 2001). Since P. anxia is a common species throughout most of North America, this finding presented an opportunity to examine the response specificity of different populations of P. anxia, as well as responses of other Phyllophaga species, over a large geographic region.
Materials and Methods
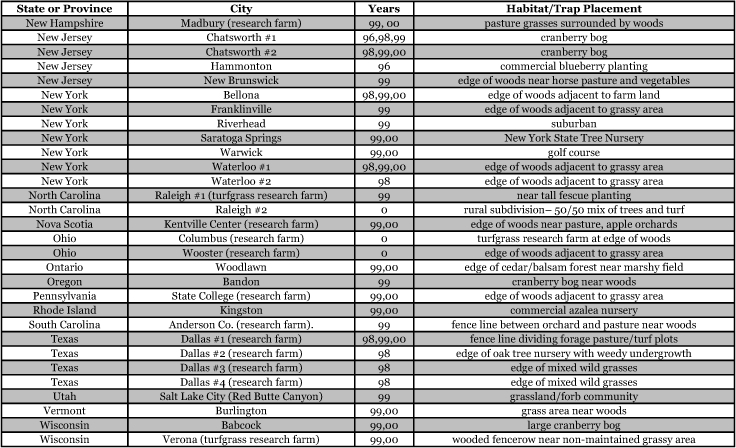
Vane traps baited with various blends of L-valine methyl ester and L-isoleucine methyl ester were deployed at 59 different locations in the U.S. and Canada during the years 1996–2001 (Figure 1). At each of these locations, traps were maintained for one to four seasons. Tables 1a and 1b list the trap locations, years during which traps were deployed, and a brief note about the habitat. The trapping sites in Carver, Lakeville, and Plympton, Massachusetts; Chatsworth, New Jersey; Babcock, Wisconsin; Lincolnville Center, Maine; Aggasiz, British Columbia; and Bandon, Oregon, were chosen because the traps could be located adjacent to cranberry acreage. Researchers involved in studies of Phyllophaga infesting turf, pasture, nursery, or other commodities maintained some trapping sites. Other sites were selected because it was likely that they might harbor different Phyllophaga species from those in other geographic areas and where the lures had never been tested.
Figure 1.
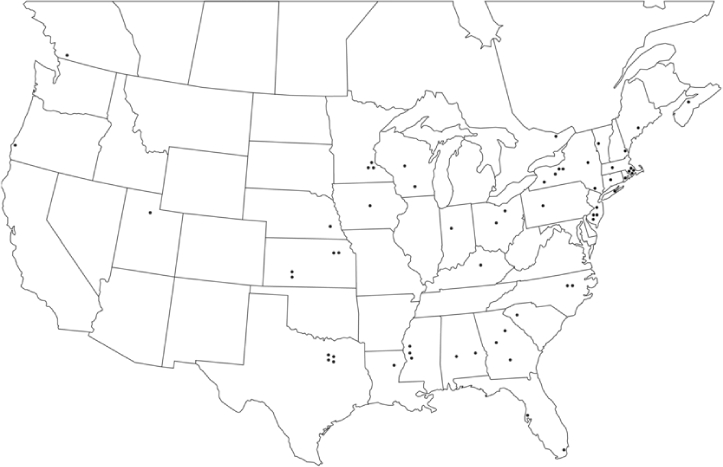
Phyllophaga spp. trapping sites, 1996–2001
Table 1a.
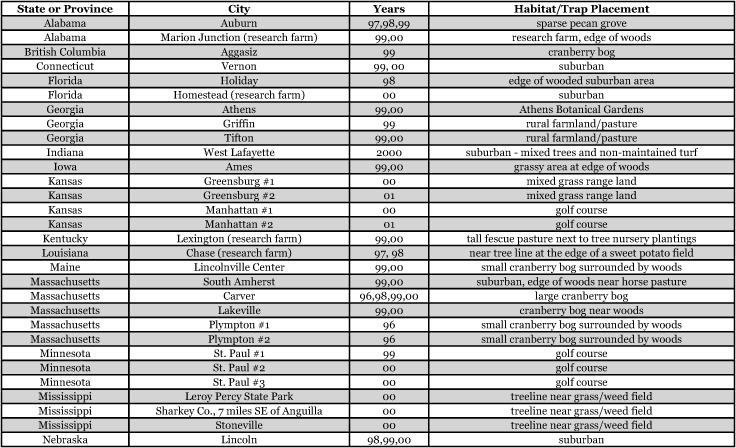
Table 1b.
When blends are referred to in this study, it is in the ratio of L-valine methyl ester/L-isoleucine methyl ester. In 1996, five blends were deployed, including 100% L-valine methyl ester, 65/35, 50/50, 35/65, and 100 % L-isoleucine methyl ester. In 1997 and 1998, 95/5 and 5/95 blends were added to the array. In 1999, 2000, and 2001, the eight blends tested included 100% L-valine methyl ester, 90/10, 80/20, 60/40, 40/60, 20/80, 10/90, and 100% L-isoleucine methyl ester. In 1996, the lures were produced in our own laboratory by loading 5 mm rubber stopper septa (Thomas Scientific, www.thomassci.com/index.jsp) with 3 mg each of various blends using hexane as the solvent. From 1997 to 2001, Dr. A.C. Oehlschlager of ChemTica Internacional S.A. (San Jose, Costa Rica, www.chemtica.com) generously supplied the rubber septa lures for the tests. During that time, the lures were loaded with 4 mg of the various blends. At each location a control trap with a blank septum also was deployed.
In 1996 and 1997, the traps used in the study were either Trécé Japanese beetle vane traps (Trécé Incorporated, www.trece.com/) or Fuji Flavor Company vane traps (Fuji Flavor Company, www.fjf.co.jp/). Beginning in the 1998 season, vane traps were fabricated in the laboratory from three-liter soda bottles and 4 mm white corrugated plastic (Figure 2). When removed from the field during the winter, these traps lasted up to three field seasons.
Figure 2.
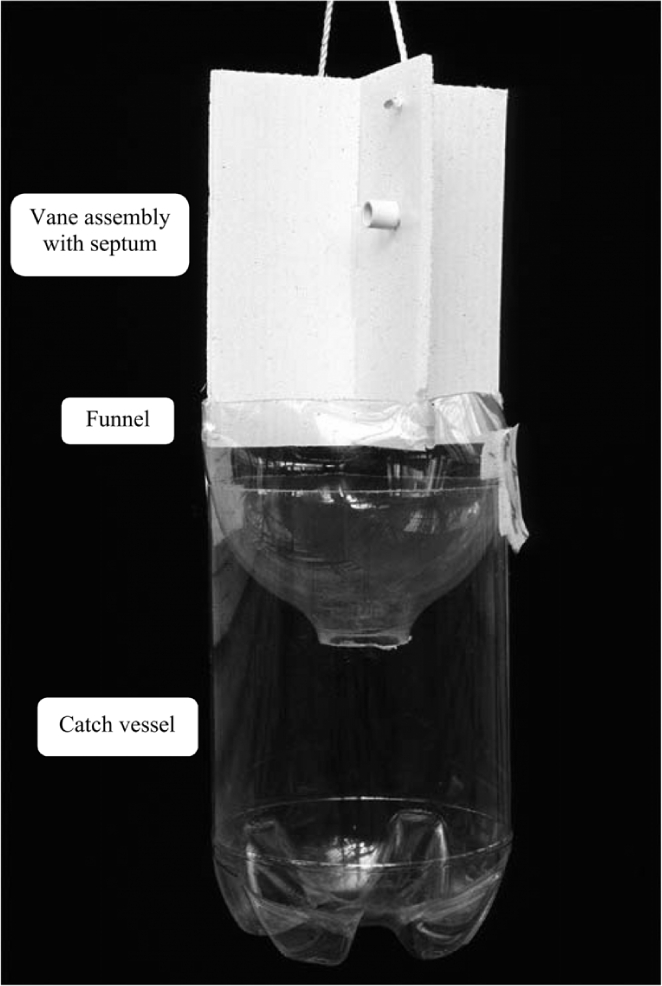
Cross vane trap constructed from 3 liter beverage container. Pheromones were applied to the rubber septum.
Traps were set in the field 15–20 meters apart and at heights of 1–2 meters. The traps were checked and re-randomized one to three times each week. Captured beetles were bagged and frozen, or infrequently preserved in ethanol. Plastic bags or bottles marked with the catch date and blend were shipped at the completion of the trapping period to Geneva, NY, for identification.
Phyllophaga species identifications were assigned using a number of published sources (Luginbill and Painter 1953;Ratcliffe 1991;Riley 1988, Saylor 1939; Saylor 1940; Woodruff and Beck 1989), comparisons with Phyllophaga species in the Cornell University insect collection, and consultations with and verifications by E. Richard Hoebeke (Cornell University, Ithaca, NY), Dr. Paul Lago (University of Mississippi, University, MS), Edward C. Riley (Texas A & M University, College Station, TX), and William B. Warner (Farnam Companies, Inc., Phoenix, AZ). In 1998, Dr. Robert Crocker (then at Texas A & M University, Dallas, TX) did identifications of the Texas catch and sent the results to Geneva NY. In 2000 and 2001, Dr. Robert Bauernfiend (Kansas State University, Manhattan, KS) did the same for the Manhattan, Kansas catches. Whenever possible, a series of each species from the various locations was pinned for later vouchering in the Cornell University insect collection.
Results and Discussion
General observations
The following outline condenses the large number of figures and tables found in this publication into general groupings for the convenience of the reader.
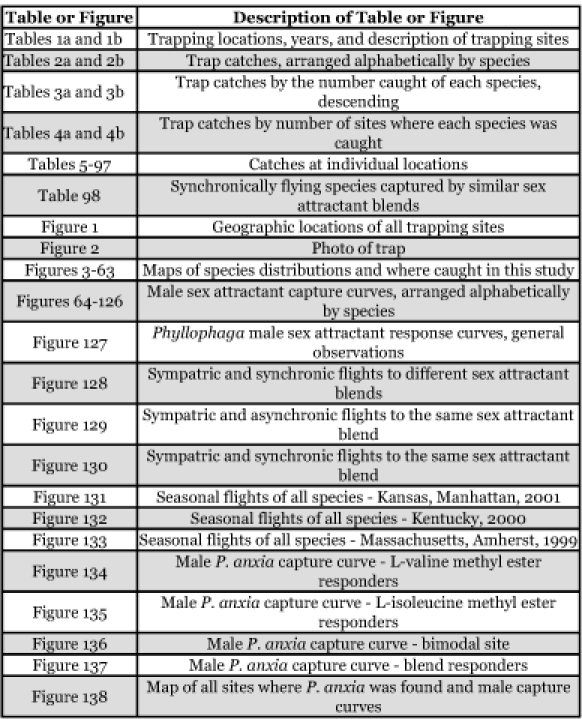
A total of 57,129 Phyllophaga individuals were examined and identified in the course of this study. The 215 captured females represented only 0.38% of the total catch, suggesting that the attractants do not function as aggregation pheromones in any of the species. A total of 145 males were counted from the control traps, amounting to only 0.25% of the total catch.
No Phyllophaga beetles were captured in Aggasiz, British Columbia; Bandon, Oregon; or Homestead, Florida. In British Columbia and Oregon, the traps were located at cranberry bogs. A light trap operated at the Oregon cranberry bog site also captured no Phyllophaga. Despite extensive sampling for root weevils in northwest commercial cranberry bogs, no white grubs have been reported (D. C. Weber, unpublished data). Moreover, when the Phyllophaga species distribution maps in Luginbill and Painter (1953) are examined, only four species of Phyllophaga are found listed from Oregon. Regarding the Homestead, Florida site, Woodruff (1961) indicates that very few of the Florida Phyllophaga species occur in Miami or in the Florida Keys. In the same publication, he points out that “The soil in the Miami area is extremely shallow and underlain by öolitic limestone and, in general, is not a good soil for white grubs.” Only 4 of the 42 species of Phyllophaga recorded from Florida have been collected in that area.
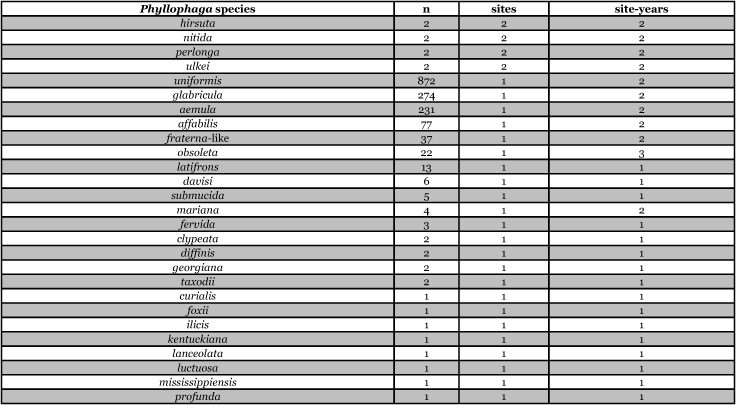
Tables 2a and 2b list alphabetically the Phyllophaga species captured, the number of males captured in each species, the number of discrete locations at which they were captured, and the total number of site-years for each species [site-years = (site A x number of years that species was captured at that site) + (site B x number of years that species was captured at that site) + .......]. Tables 3a and 3b are sorted by descending catch numbers, beginning with the Phyllophaga species caught in the greatest number. Tables 4a and 4b are sorted by site, listing in descending order the number of sites at which a particular species was recorded.
Table 2a.
Male catches, sites, and sites-years sorted by species.
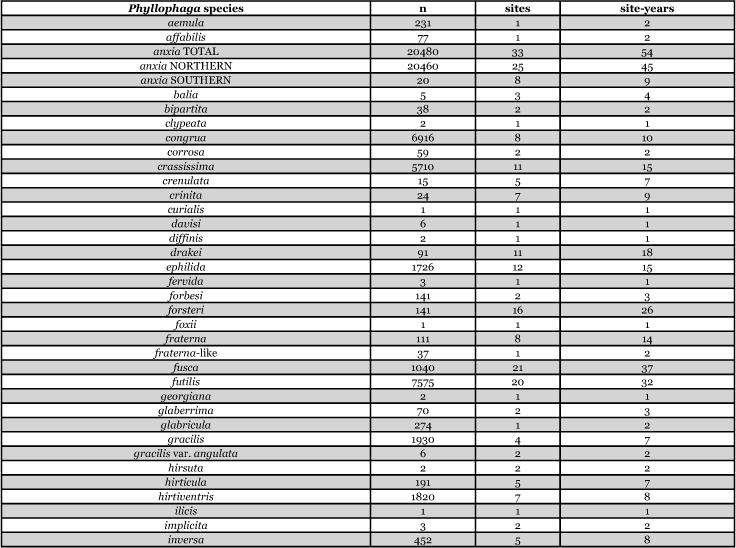
Table 2b.
Male catches, sites, and sites-years sorted by species.
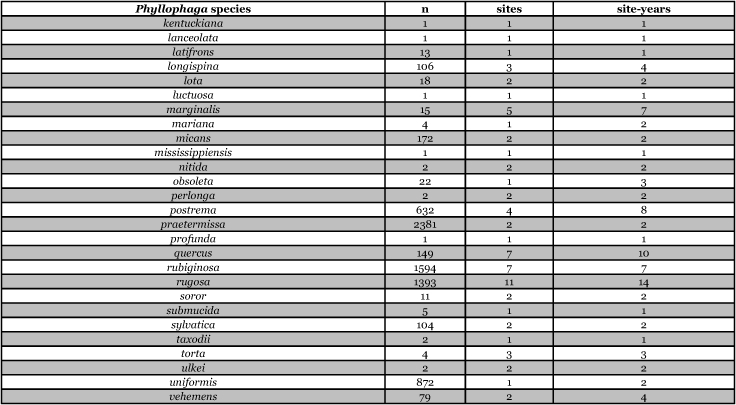
Table 3a.
Male catches, sites, and sites-years sorted by n.
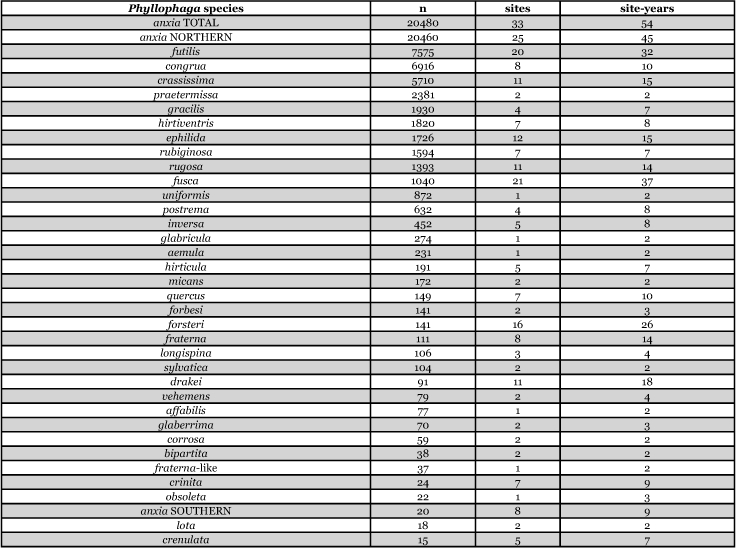
Table 3b.
Male catches, sites, and sites-years sorted by n.
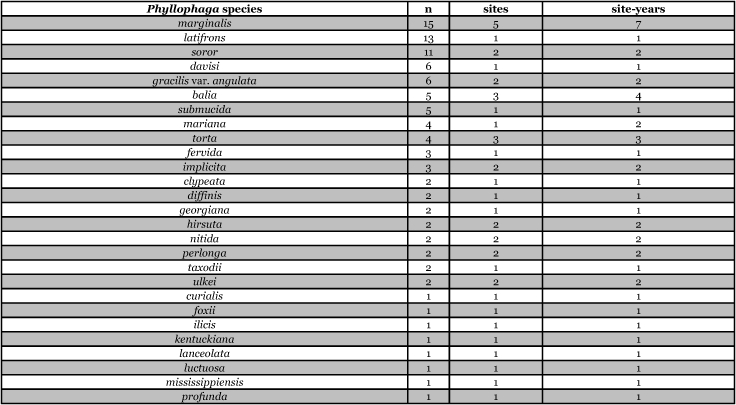
Table 4a.
Male catches, sites, and sites-years sorted by sites.
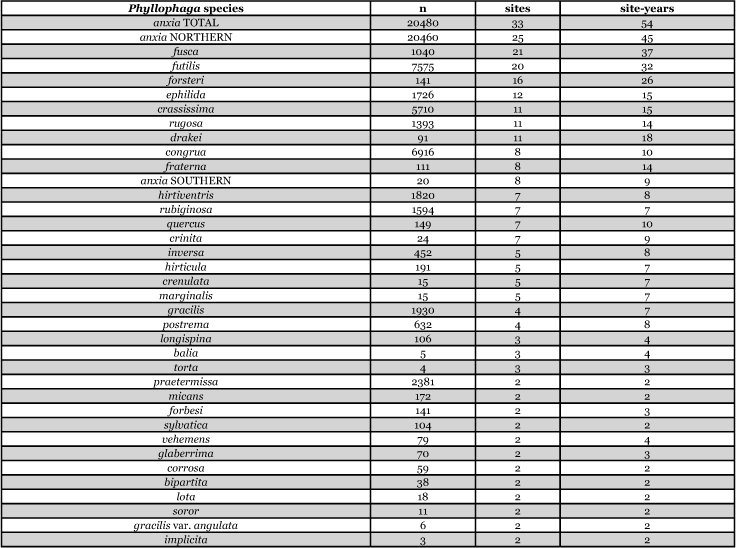
Table 4b.
Male catches, sites, and sites-years sorted by sites.
Of all site-years when and where beetles were captured, only two (NJ Chatsworth #2, 1999 Table 59 and UT Salt Lake City, 1999, Table 91) recorded a single species of Phyllophaga during a flight season. The average number of species captured during a site-year was 4.15. Three sites (AL Auburn, 1998, Table 6; KS Manhattan #1, 2000, Table 27; and KS Manhattan #2, 2001, Table 28) recorded more than 10 species of Phyllophaga captured during the flight season.
Table 59.
New Jersey, Chatsworth #2 1999
Blends indicate the ratio of the methyl esters of L-valine/L-isoleucine

Table 91.
Utah, Salt Lake City 1999
Blends indicate the ratio of the methyl esters of L-valine/L-isoleucine
![]()
Table 6.
Alabama, Auburn 1998
Blends indicate the ratio of the methyl esters of L-valine/L-isoleucine
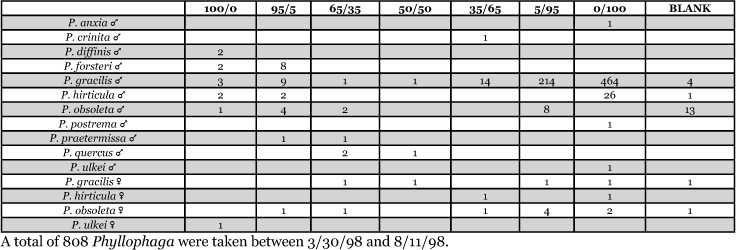
Table 27.
Kansas, Manhattan #1 2000
Blends indicate the ratio of the methyl esters of L-valine/L-isoleucine

Table 28.
Kansas, Manhattan #2 2001
Blends indicate the ratio of the methyl esters of L-valine/L-isoleucine

The species that was taken in the greatest number (20,480), in the greatest number of sites (33), and in the greatest number of site-years (54) was P. anxia. This is not surprising given that, as was indicated previously, it is the most widespread species of Phyllophaga in North America. Luginbill and Painter (1953) list it as occurring in every state in the United States except Arizona, California, Florida, Nevada, West Virginia, and Wyoming. They also report P. anxia from all ten Canadian provinces. Woodruff and Beck (1989) have subsequently reported it from Florida. W. B. Warner (personal communication) has examined a specimen of P. anxia from California and has reports of P. anxia in Arizona.
Males of ten other Phyllophaga species were also captured in numbers >1000. These include P. futilis, P. congrua, P. crassissima, P. praetermissa, P. gracilis, P. hirtiventris, P. ephilida, P. rubiginosa, P. rugosa, and P. fusca. Males of 13 species were captured in numbers >100 but <1000 and males of 15 species were captured in numbers >10 but <100 (Tables 3a and 3b). Eighteen species of Phyllophaga were recorded at ≥5 locations and 8 species were recorded at ≥11 locations (Tables 4a and 4b).
Geographical distributions and range extensions
Geographical distribution maps of Phyllophaga species captured during this study are found in Figures 3–63, arranged alphabetically by species. Shaded areas in these figures indicate the geographical ranges conveyed by Luginbill and Painter (1953) or Woodruff and Beck (1989) [P. (Phytalus) georgiana and P. (Phytalus) obsoleta only].
Figure 3.
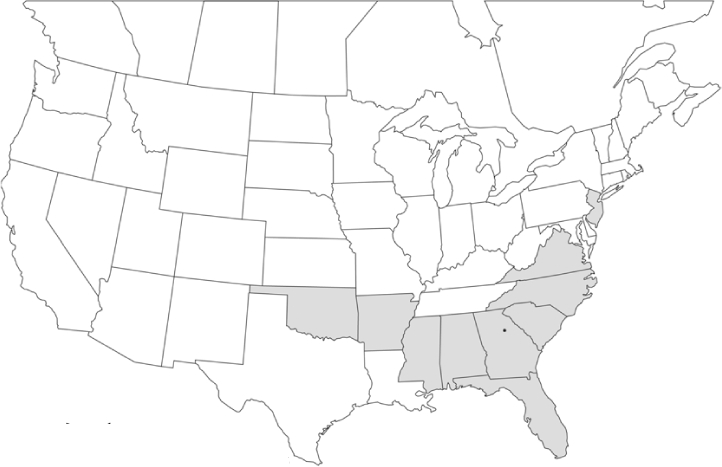
P. aemula
• = catch sites, n = 231 beetles
Shaded areas = distributions from Luginbill and Painter, 1953
Most captures of Phyllophaga species recorded during this study were found within the geographical species distributions reported by Luginbill and Painter (1953). There are, however, several range extensions to report. The following species were found in locations in addition to those reported by Luginbill and Painter: P. curialis (Figure 14), P. drakei (Figure 17), P. forbesi (Figure 20), P. foxii (Figure 22), P. futilis (Figure 25), P. gracilis (Figure 29), P. gracilis var. angulata (Figure 30), P. hirtiventris (Figure 33), P. longispina (Figure 40), P. lota (Figure 41), P. marginalis (Figure 43), P. (fraterna) mississippiensis (Figure 46), P. postrema (Figure 50), P. praetermissa (Figure 51), P. quercus (Figure 53), and P. taxodii (Figure 59). Riley (1988) had previously noted range extensions of P. forbesi, P. quercus, and P. taxodii into Louisiana.
Figure 14.
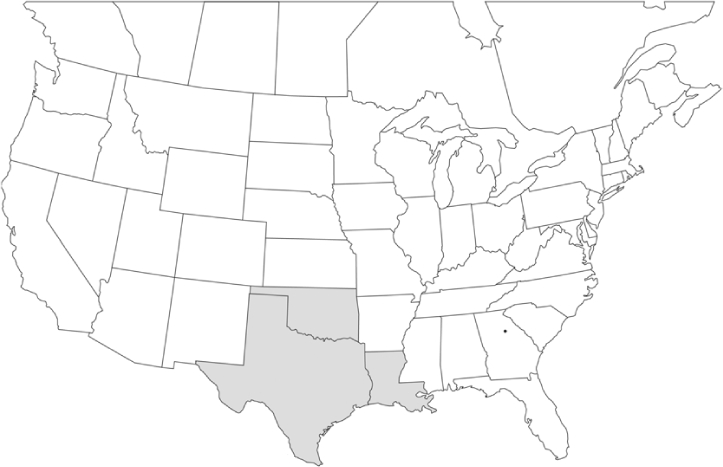
P. curialis
• = catch sites, n = 1 beetle
Shaded areas = distributions from Luginbill and Painter, 1953
Figure 17.
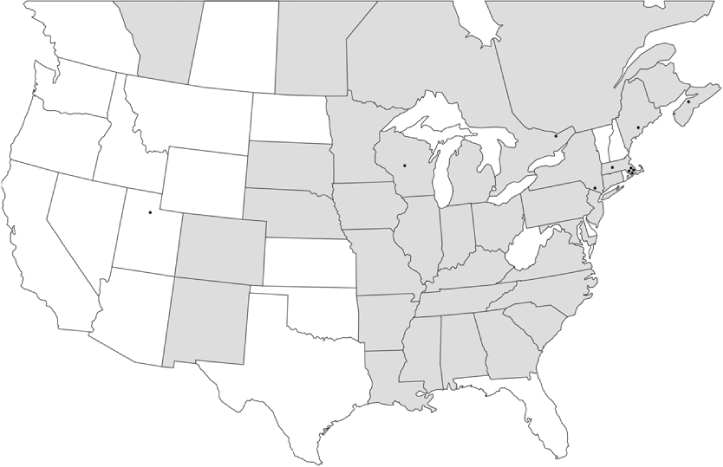
P. drakei
• = catch sites, n = 91 beetles
Shaded areas = distributions from Luginbill and Painter, 1953
Figure 20.
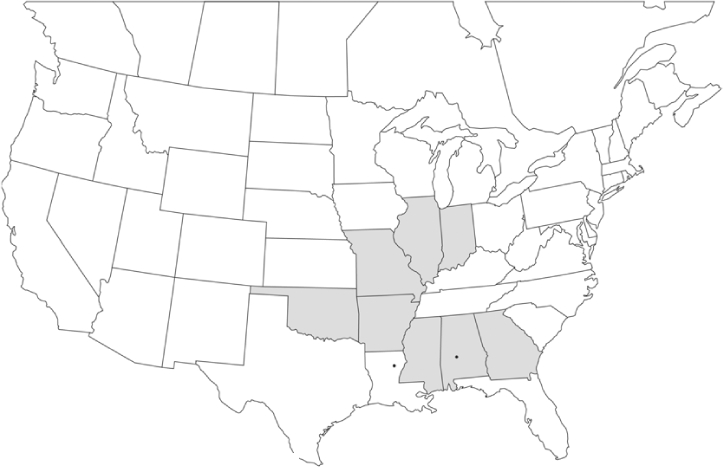
P. forbesi
• = catch sites, n = 141 beetles
Shaded areas = distributions from Luginbill and Painter, 1953
Figure 22.
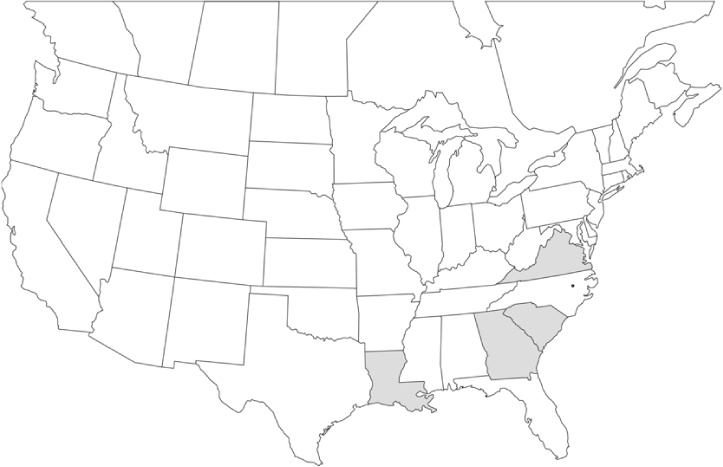
P. foxii
• = catch sites, n = 1 beetle
Shaded areas = distributions from Luginbill and Painter, 1953
Figure 25.
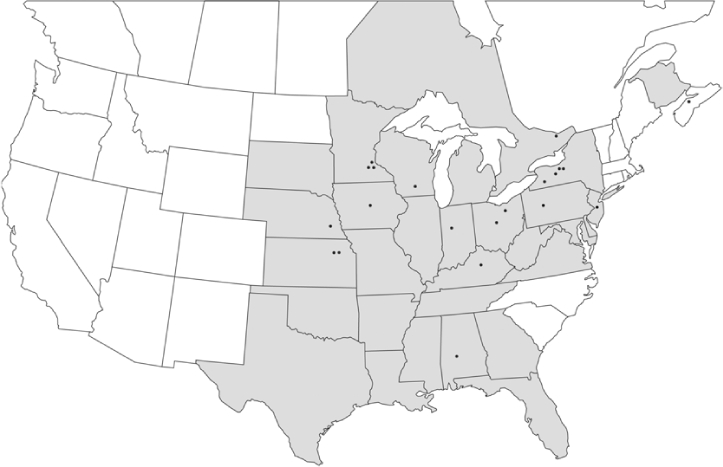
P. futilis
• = catch sites, n = 7575 beetles
Shaded areas = distributions from Luginbill and Painter, 1953
Figure 29.
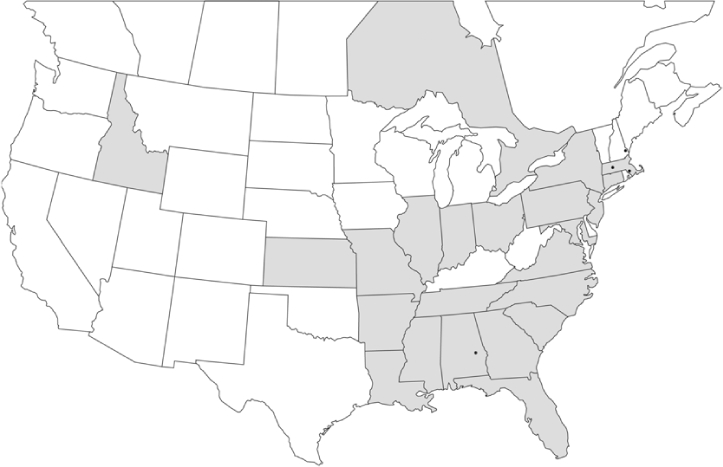
P. gracilis
• = catch sites, n= 1930 beetles
Shaded areas = distributions from Luginbill and Painter, 1953
Figure 30.
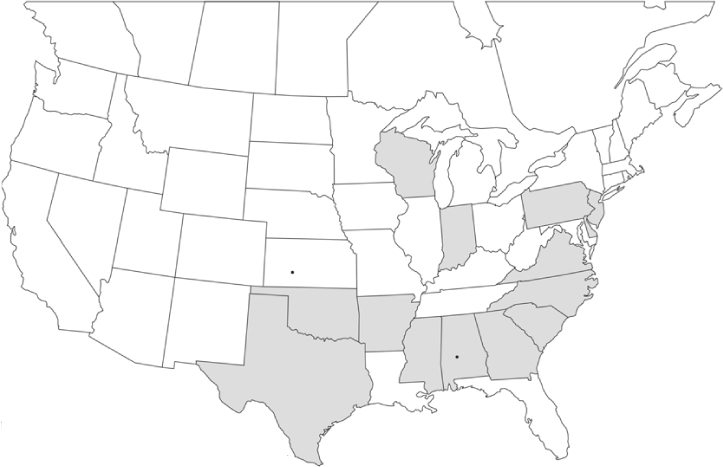
P. gracilis var angulata
• = catch sites, n = 6 beetles
Shaded areas = distributions from Luginbill and Painter, 1953
Figure 33.
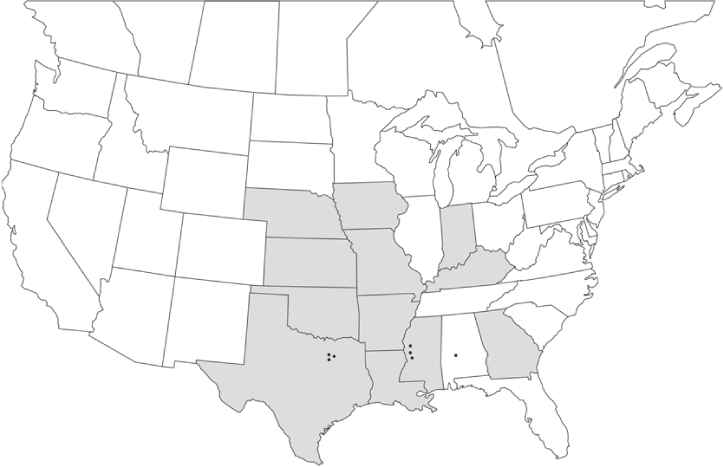
P. hirtiventris
• = catch sites, n = 1820 beetles
Shaded areas = distributions from Luginbill and Painter, 1953
Figure 40.
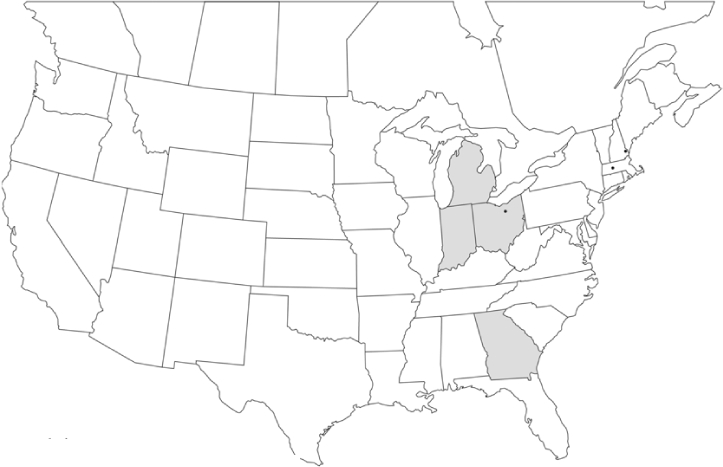
P. longispina
• = catch sites, n = 106 beetles
Shaded areas = distributions from Luginbill and Painter, 1953
Figure 41.
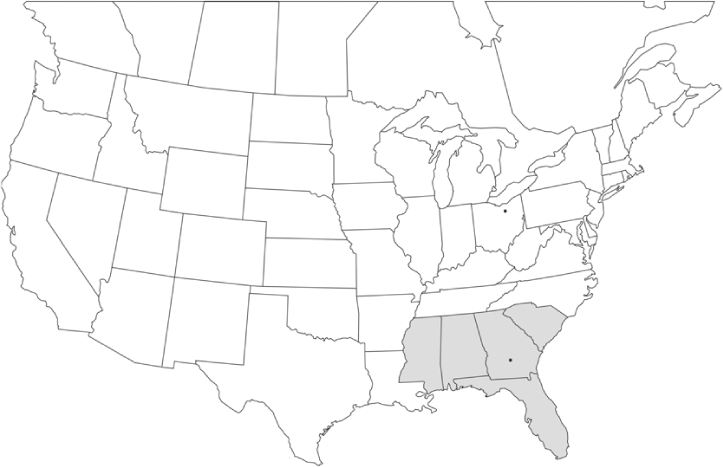
P. lota
• = catch sites, n = 18 beetles
Shaded areas = distributions from Luginbill and Painter, 1953
Figure 43.
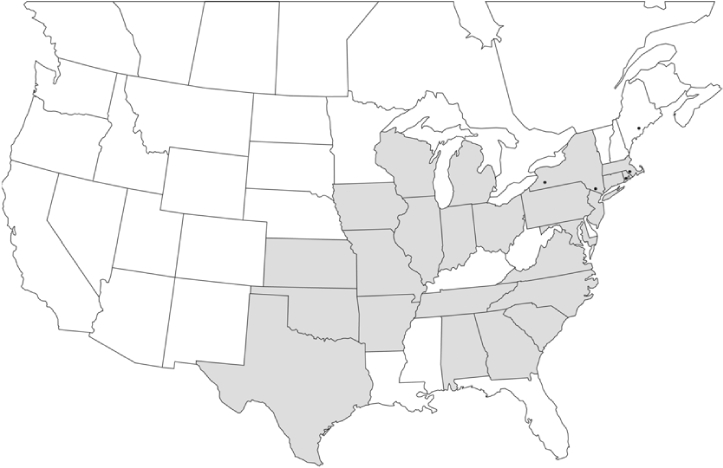
P. marginalis
• = catch sites, n = 15 beetles
Shaded areas = distributions from Luginbill and Painter, 1953
Figure 46.
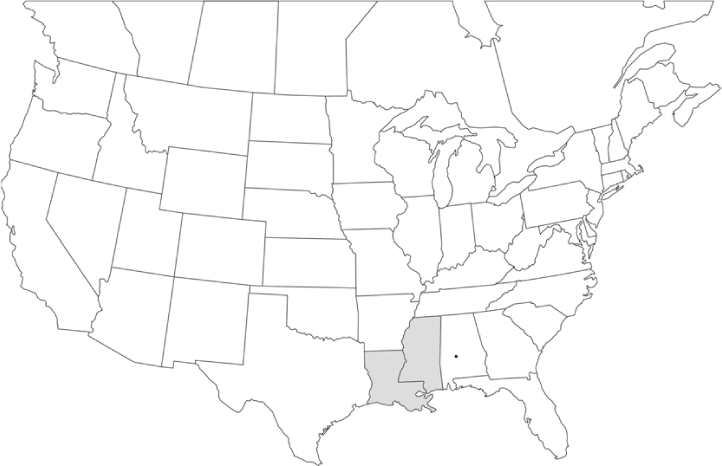
P. (fraterna) mississippiensis
• = catch sites, n = 1 beetle
Shaded areas = distributions from Luginbill and Painter, 1953
Figure 50.
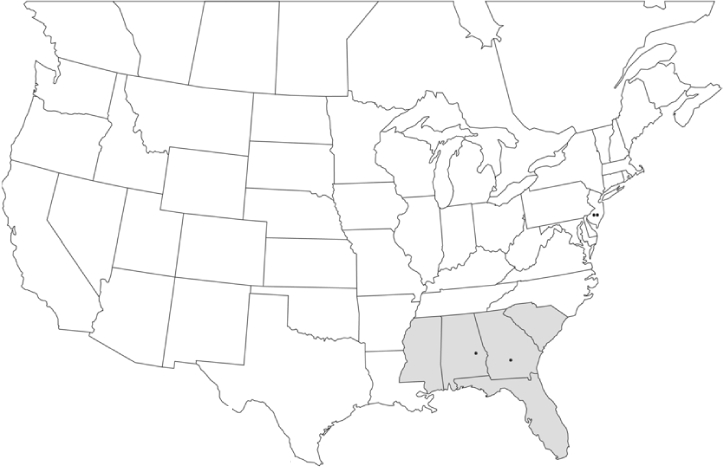
P. postrema
• = catch sites, n = 632 beetles
Shaded areas = distributions from Luginbill and Painter, 1953
Figure 51.
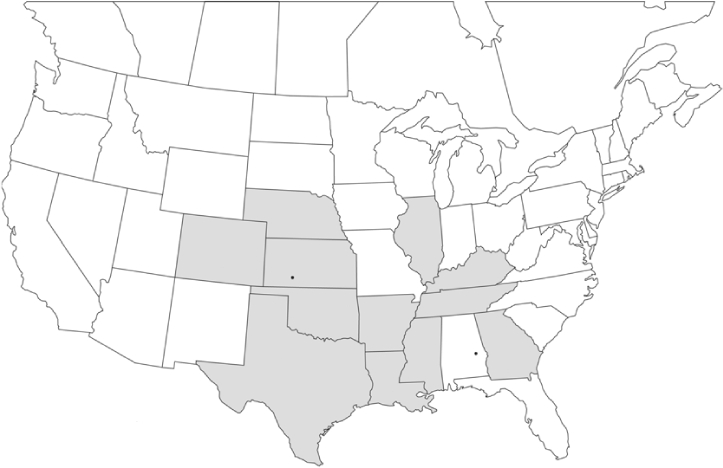
P. praetermissa
• = catch sites, n = 2381 beetles
Shaded areas = distributions from Luginbill and Painter, 1953
Figure 53.
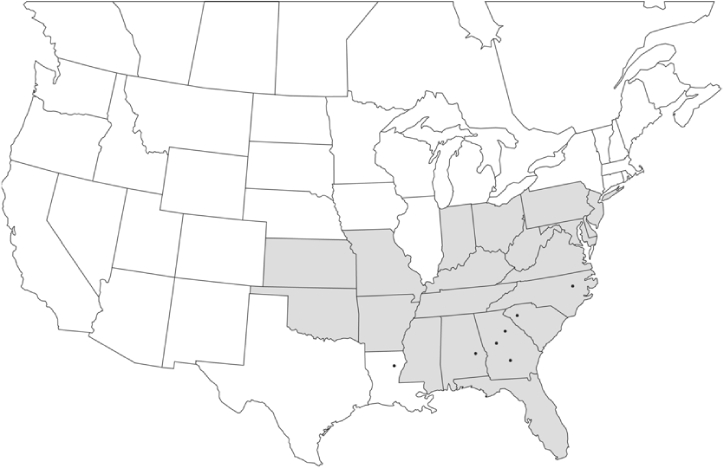
P. quercus
• = catch sites, n = 149 beetles
Shaded areas = distributions from Luginbill and Painter, 1953
Figure 59.
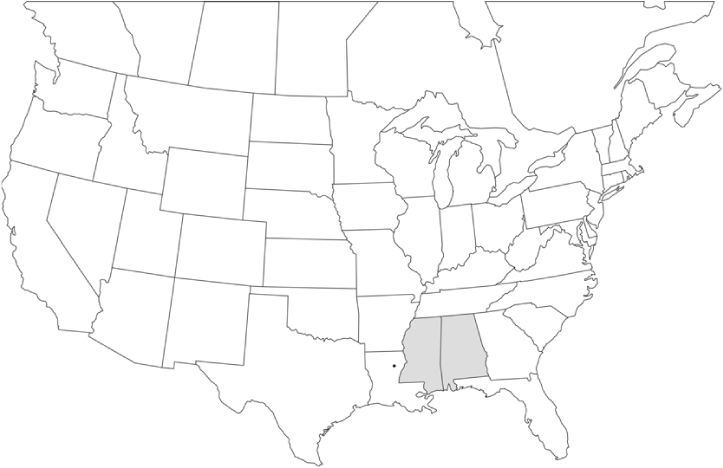
P. taxodii
• = catch sites, n = 2 beetles
Shaded areas = distributions from Luginbill and Painter, 1953
Figure 4.
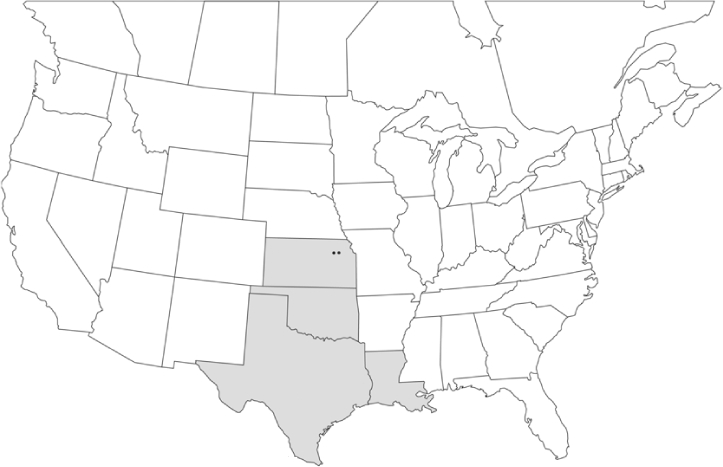
P. affabilis
• = catch sites, n = 77 beetles
Shaded areas = distributions from Luginbiil and Painter, 1953
Figure 5.
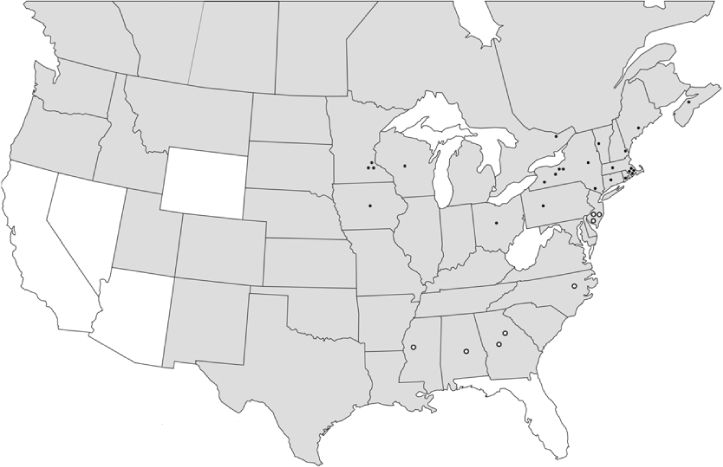
P. anxia
• = catch siles-norlhem form, n = 20,640 beetles
○ = catch sites-southern form, n = 20 beetles
Shaded areas = distributions from Luginbill and Painter, 1953
Figure 7.
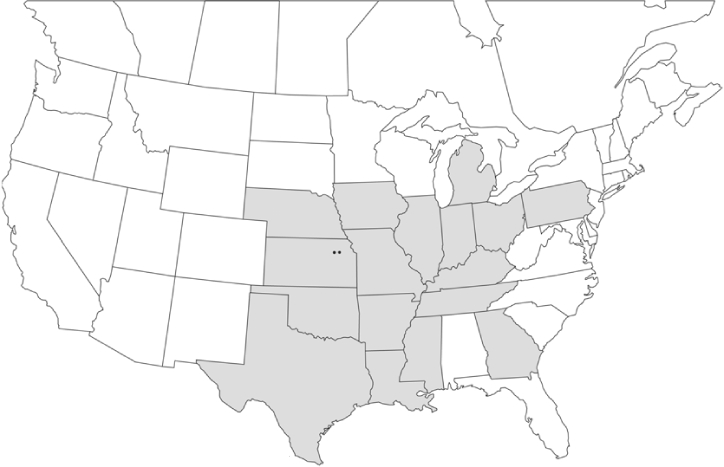
P. bipartita
• = catch sites, n = 38 beetles
Shaded areas = distributions from Luginbill and Painter, 1953
Figure 8.
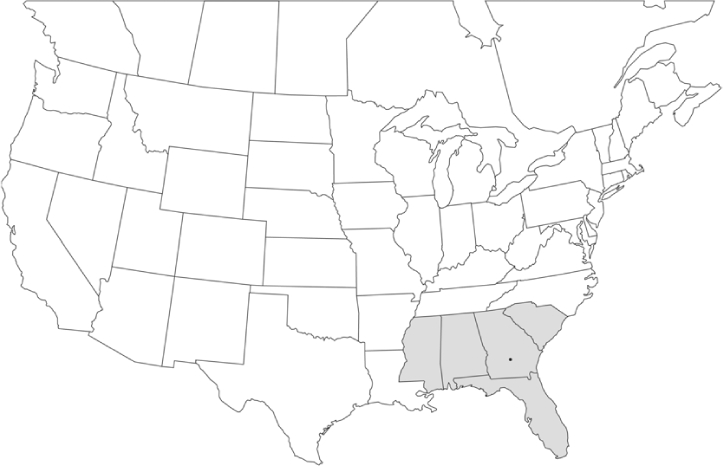
P. clypeata
• = catch sites, n = 2 beetles
Shaded areas = distributions from Luginbill and Painter, 1953
Figure 10.
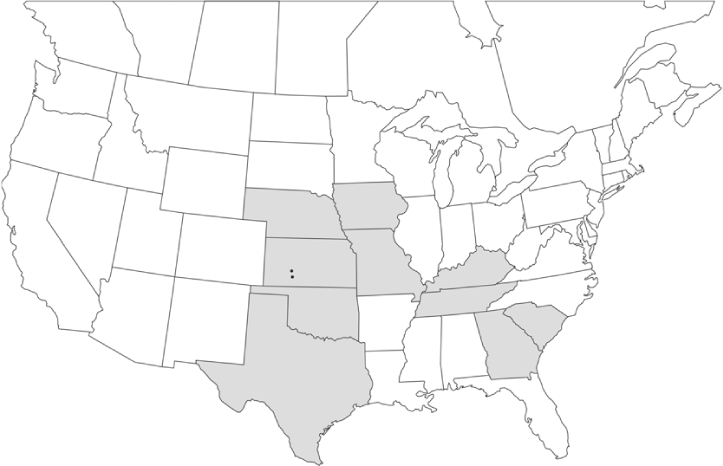
P. corrosa
• = catch sites, n = 59 beetles
Shaded areas = distributions from Luginbill and Painter, 1953
Figure 11.
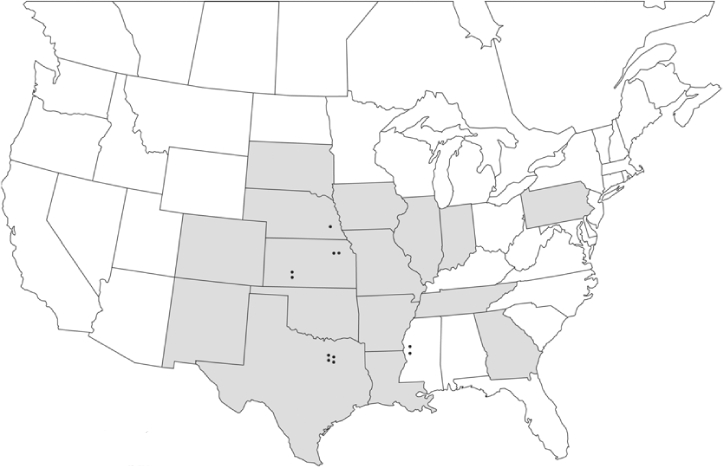
P. crassissima
• = catch sites, n = 5710 beetles
Shaded areas = distributions from Luginbill and Painter, 1953
Figure 12.
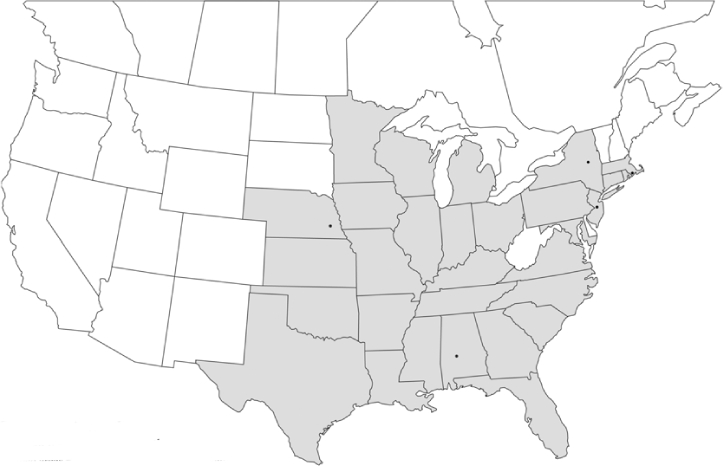
P. crenulata
• = catch sites, n = 15 beetles
Shaded areas = distributions from Luginbill and Painter, 1953
Figure 13.
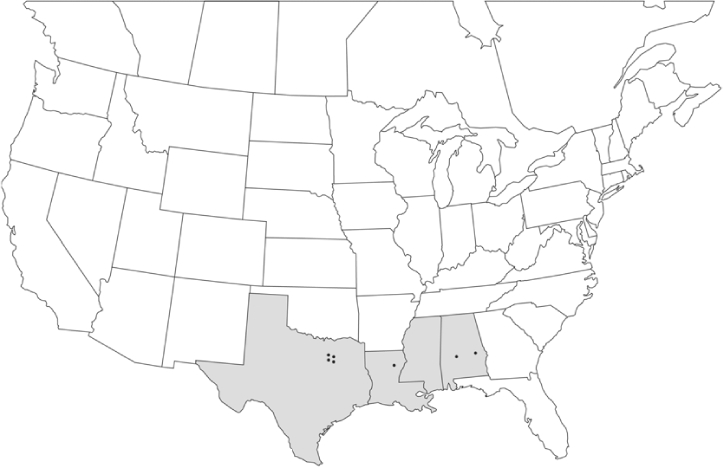
P. crinita
• = catch sites, n = 24 beetles
Shaded areas = distributions from Luginbill and Painter, 1953
Figure 15.
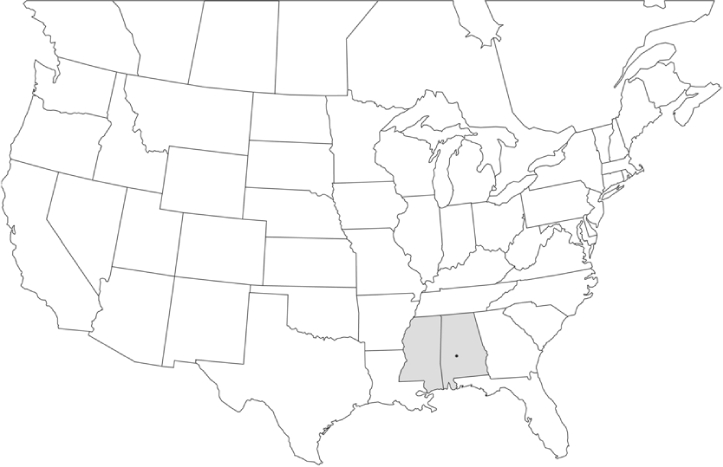
P. davisi
• = catch sites, n = 6 beetles
Shaded areas = distributions from Luginbill and Painter, 1953
Figure 16.
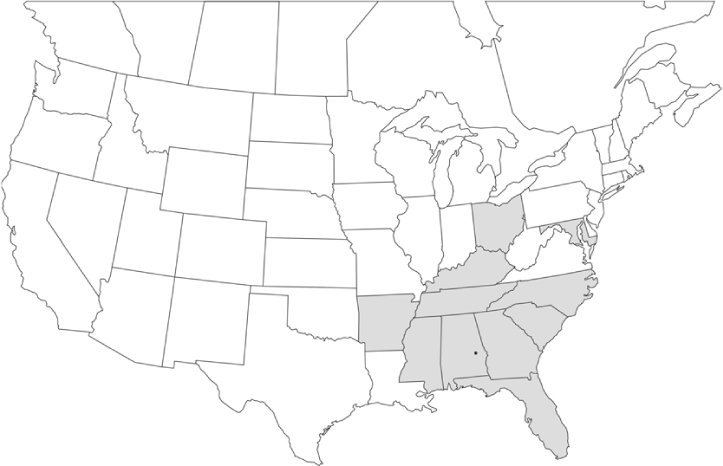
P. diffinis
• = catch sites, n = 2 beetles
Shaded areas = distributions from Luginbill and Painter, 1953
Figure 18.
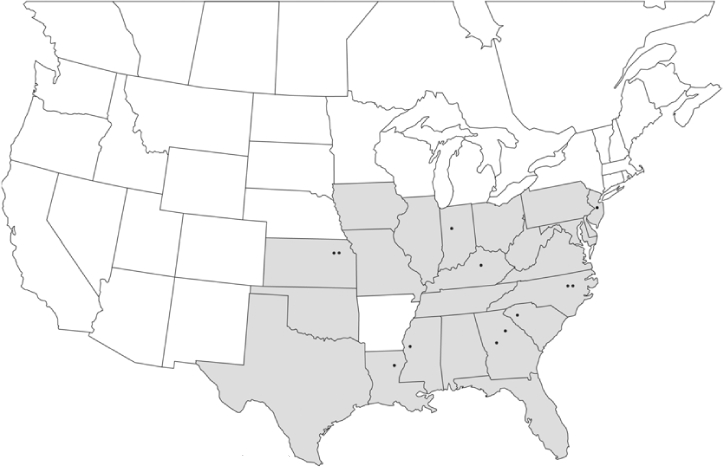
P. ephilida
• = catch sites, n = 1726 beetles
Shaded areas = distributions from Luginbill and Painter, 1953
Figure 19.
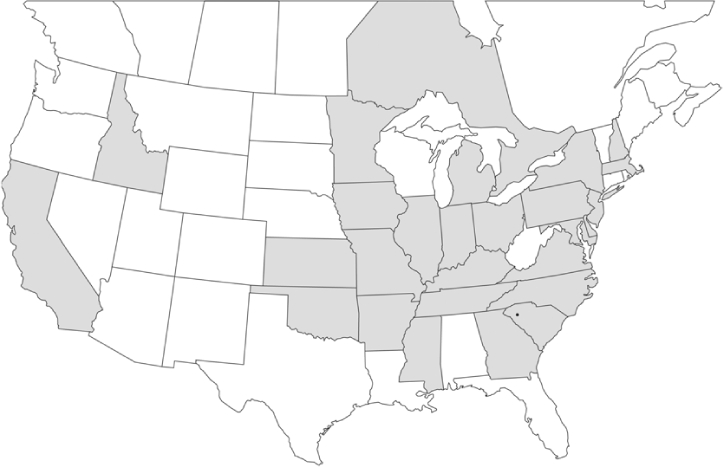
P.fervida
• = catch sites, n = 3 beetles
Shaded areas = distributions from Luginbill and Painter, 1953
Figure 21.
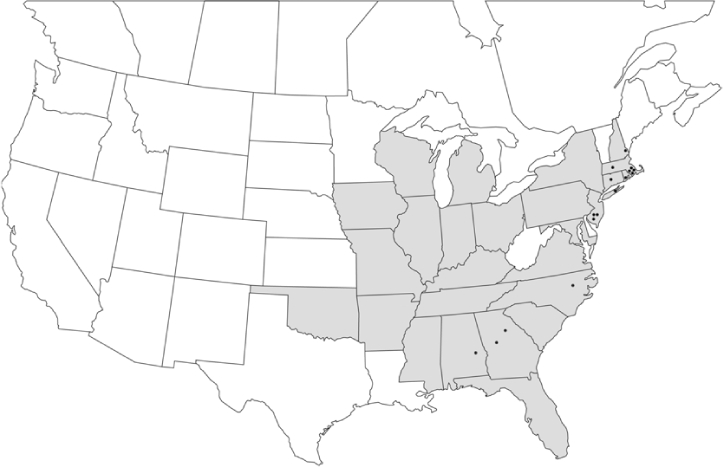
P. forsteri
• = catch sites, n = 141 beetles
Shaded areas = distributions from Luginbill and Painter, 1953
Figure 23.
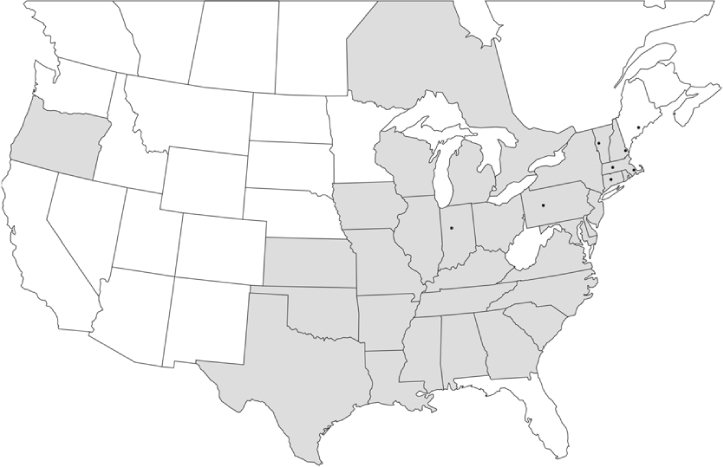
P. fraterna
• = catch sites, n = 111 beetles
Shaded areas = distributions from Luginbill and Painter, 1953
Figure 24.
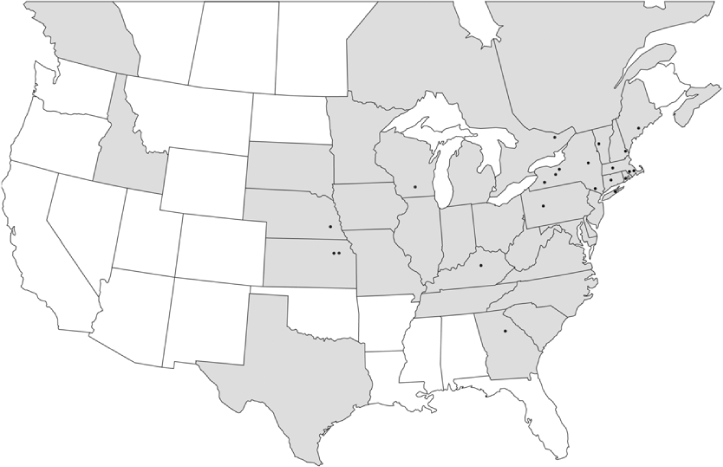
P. fusca
• = catch sites, n = 1040 beetles
Shaded areas = distributions from Luginbill and Painter, 1953
Figure 26.
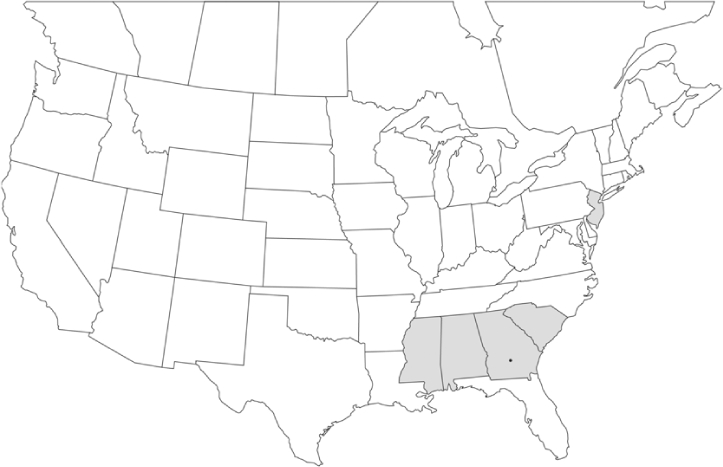
P. (Phytalus) georgiana
• = catch sites, n = 2 beetles
Shaded areas = distributions from Woodruff and Beck, 1988
Figure 27.
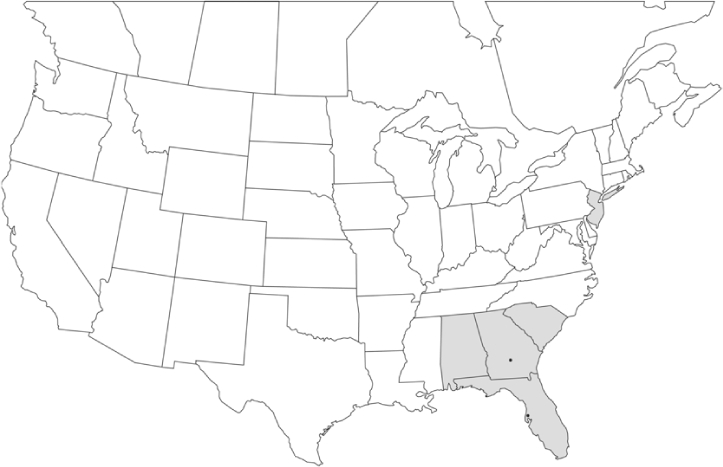
P glaberrima
• = catch sites, n = 70 beetles
Shaded areas = distributions from Luginbill and Painter, 1953
Figure 28.
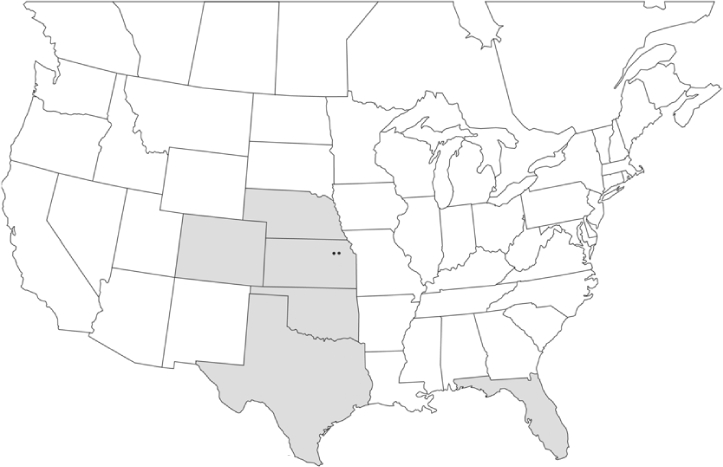
P glabricula
• = catch sites, n = 274 beetles
Shaded areas = distributions from Luginbill and Painter, 1953
Figure 31.
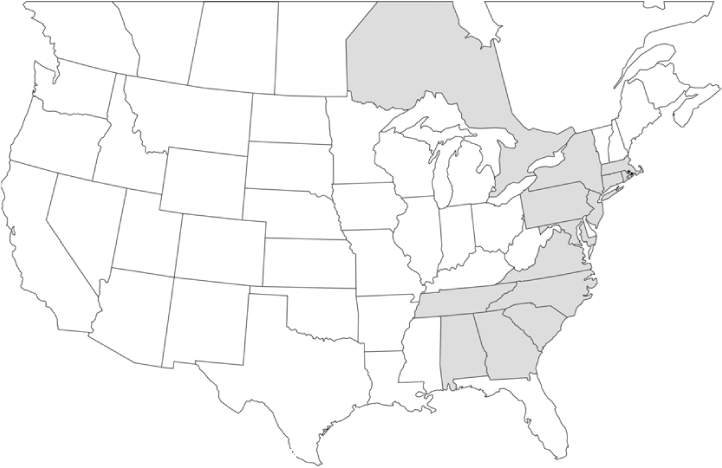
P. hirsuta
• = catch sites, n = 2 beetles
Shaded areas = distributions from Luginbill and Painter, 1953
Figure 32.
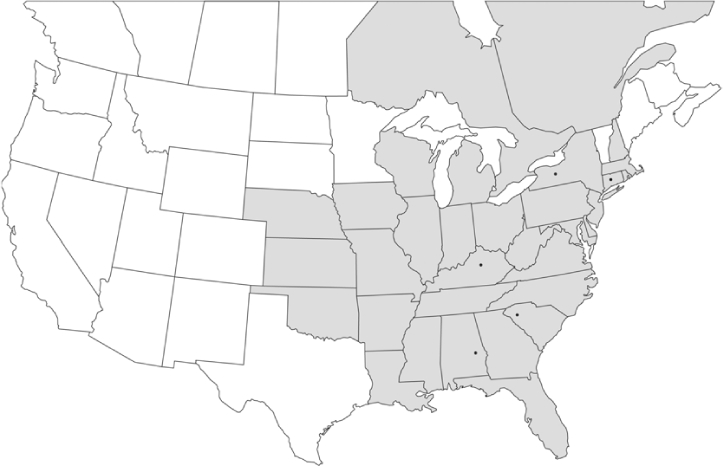
P. hirticula
• = catch sites, n = 191 beetles
Shaded areas = distributions from Luginbill and Painter, 1953
Figure 34.
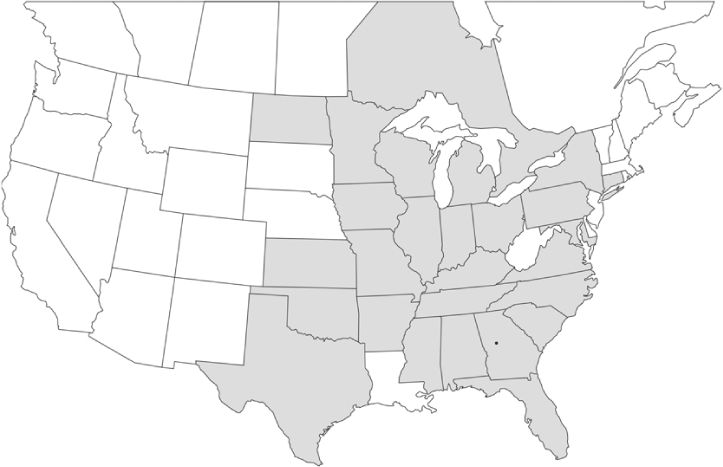
P. ilicis
• = catch sites, n = 1 beetle
Shaded areas = distributions from Luginbill and Painter, 1953
Figure 35.
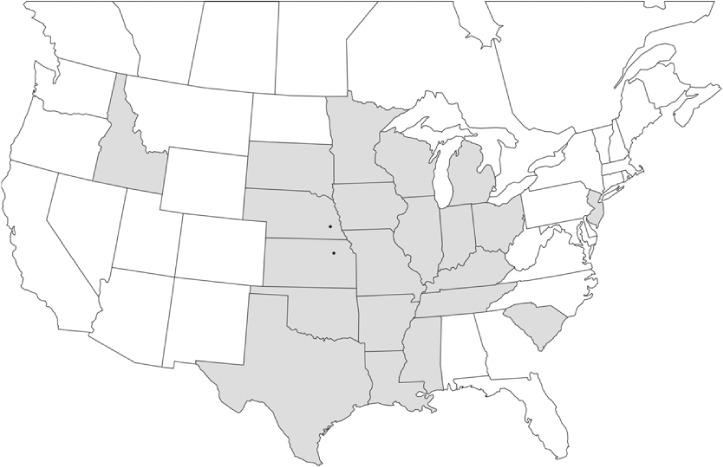
P. implicita
• = catch sites, n = 3 beetles
Shaded areas = distributions from Luginbill and Painter, 1953
Figure 36.
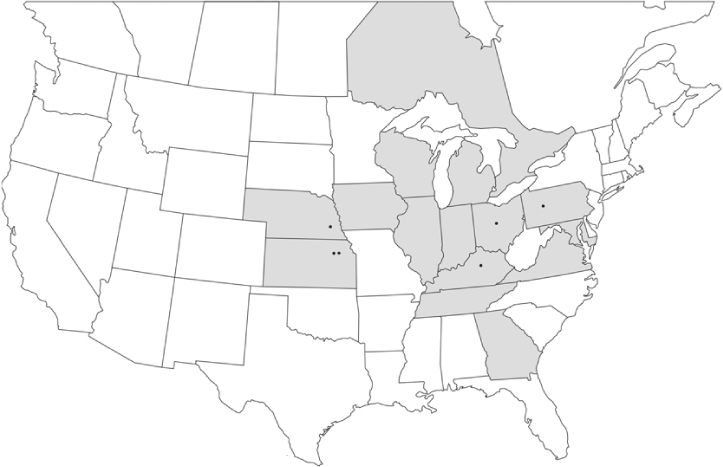
P. inversa
• = catch sites, n = 452 beetles
Shaded areas = distributions from Luginbill and Painter, 1953
Figure 37.
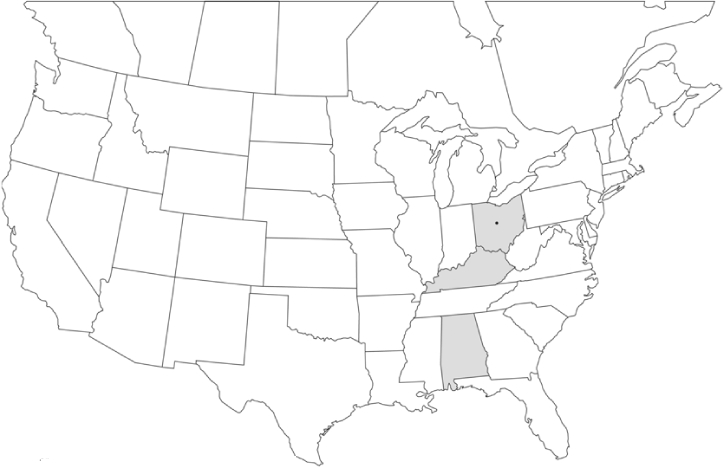
P. kentuckiana
• = catch sites, n = 1 beetle
Shaded areas = distributions from Luginbill and Painter, 1953
Figure 38.
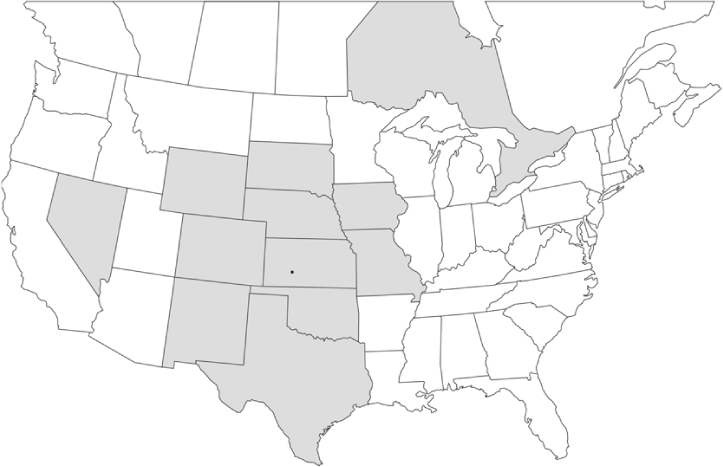
P. lanceolata
• = catch sites, n = 1 beetle
Shaded areas = distributions from Luginbill and Painter, 1953
Figure 39.
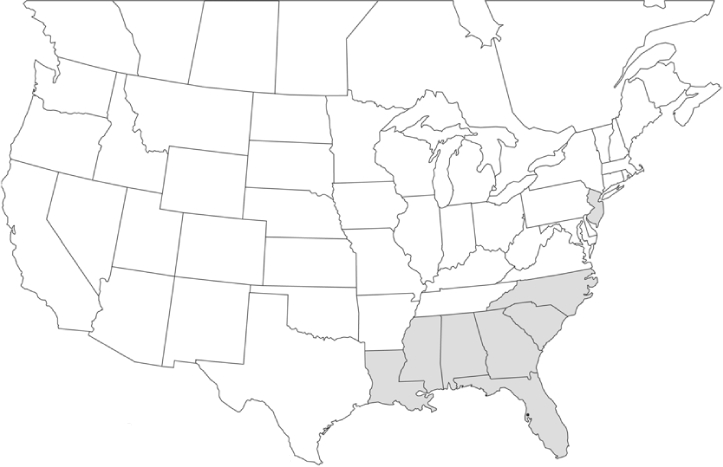
P. latifrons
• = catch sites, n = 13 beetles
Shaded areas = distributions from Luginbill and Painter, 1953
Figure 42.
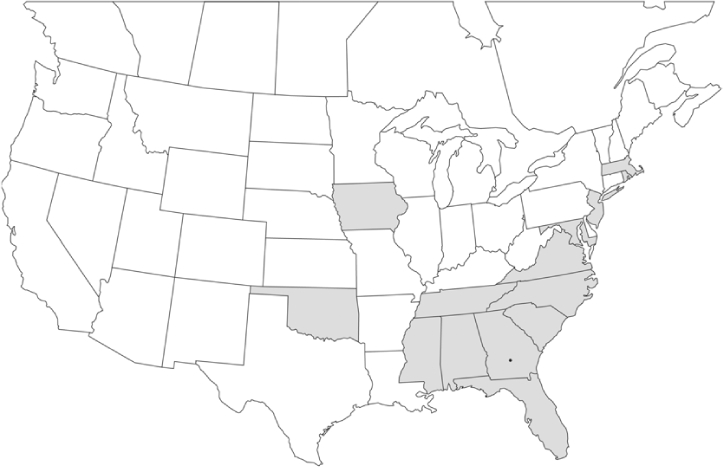
P. luctuosa
• = catch sites, n = 1 beetle
Shaded areas = distributions from Luginbill and Painter, 1953
Figure 44.
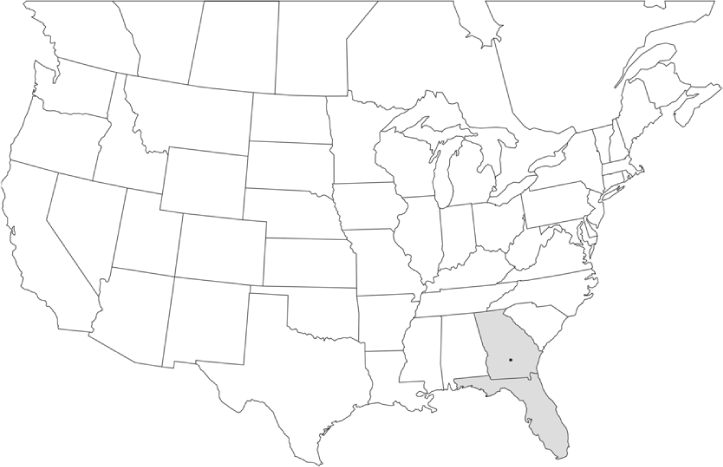
P. mariana
• = catch sites, n = 4 beetles
Shaded areas = distributions from Luginbill and Painter, 1953
Figure 45.
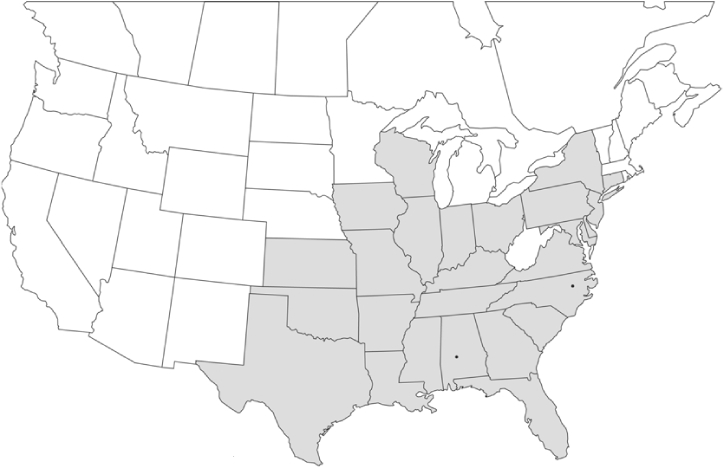
P. micans
• = catch sites, n = 172 beetles
Shaded areas = distributions from Luginbill and Painter, 1953
Figure 47.
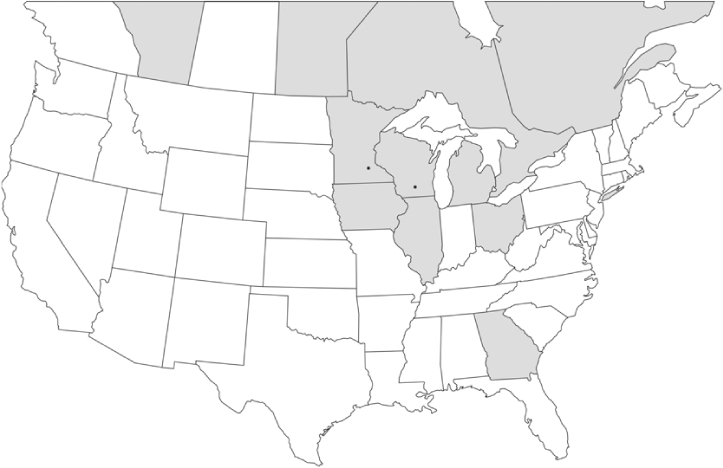
P. nitida
• = catch sites, n = 2 beetles
Shaded areas = distributions from Luginbill and Painter, 1953
Figure 48.
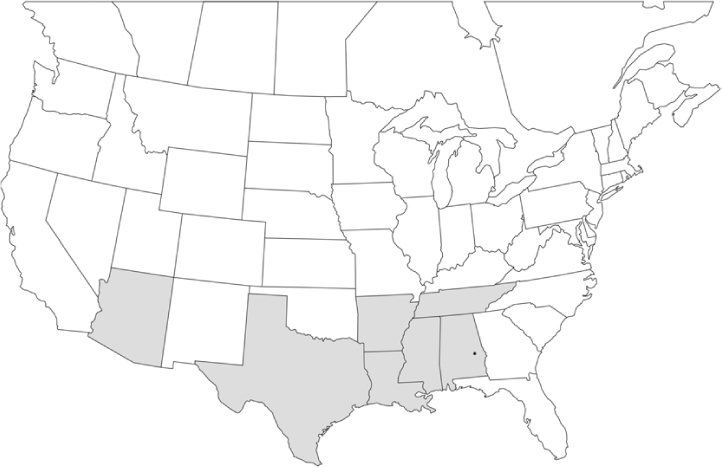
P. obsoleta
• = catch sites, n = 22 beetles
Shaded areas = distributions from Woodruff and Beck, 1988
Figure 49.
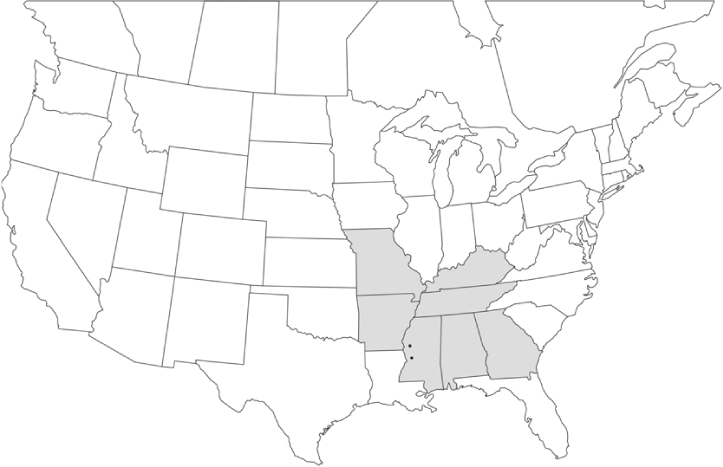
P. perlonga
• = catch sites, n = 2 beetles
Shaded areas = distributions from Luginbill and Painter, 1953
Figure 52.
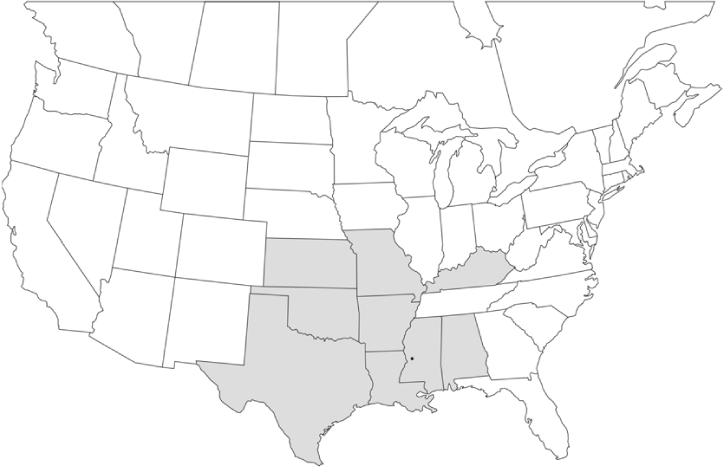
P. profunda
• = catch sites, n = 1 beetle
Shaded areas = distributions from Luginbill and Painter, 1953
Figure 54.
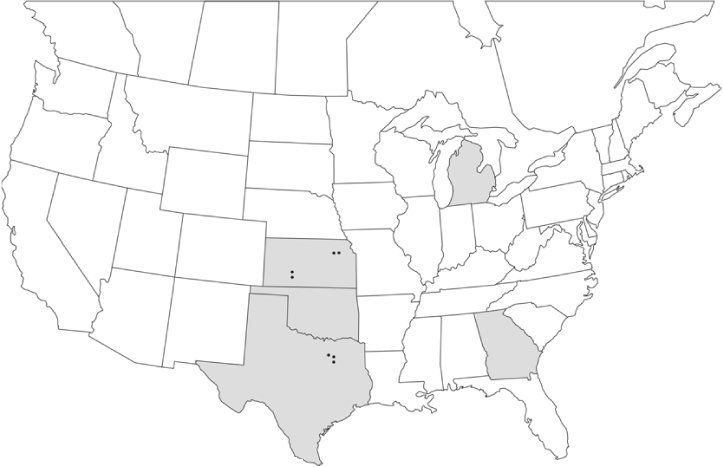
P. rubiginosa
• = catch sites, n = 1594 beetles
Shaded areas = distributions from Luginbill and Painter, 1953
Figure 55.
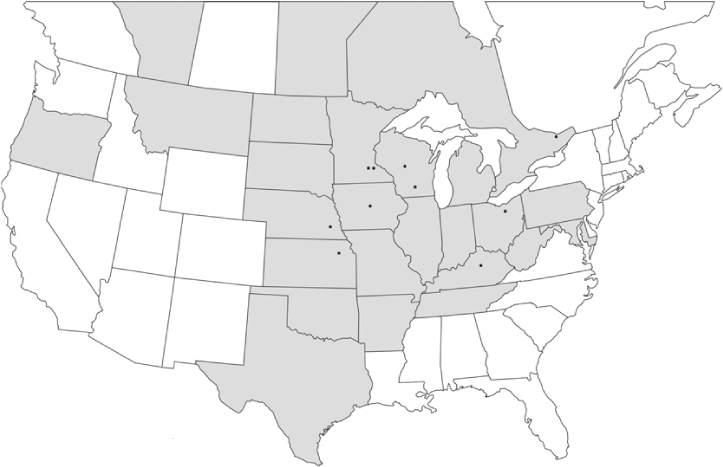
P. rugosa
• = catch sites, n = 1393 beetles
Shaded areas = distributions from Luginbill and Painter, 1953
Figure 56.
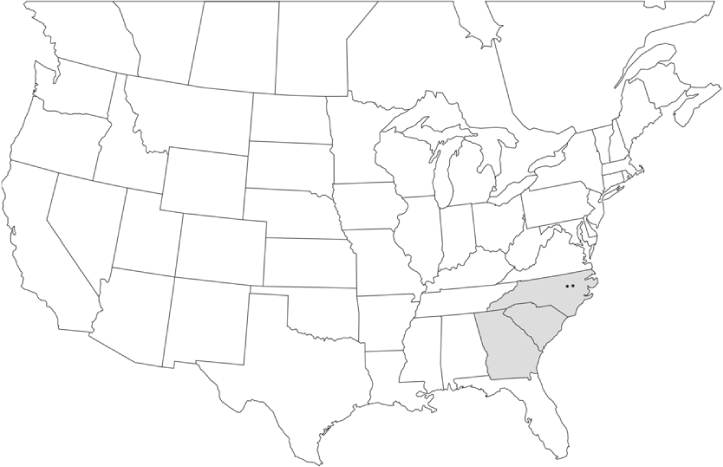
P. soror
• = catch sites, n = 11 beetles
Shaded areas = distributions from Luginbill and Painter, 1953
Figure 57.
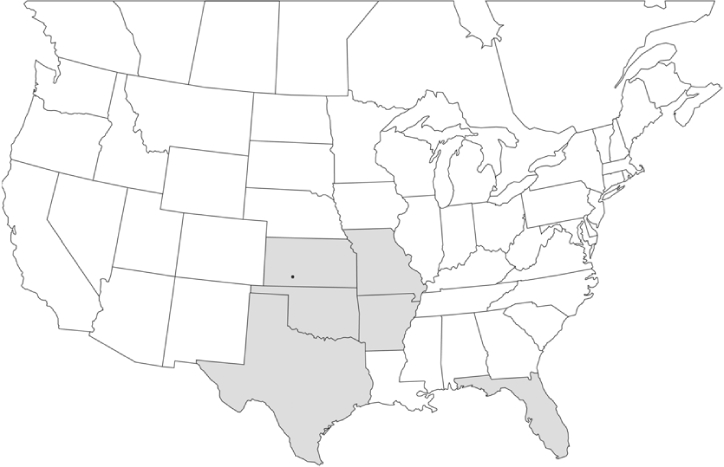
P. submucida
• = catch sites, n = 5 beetles
Shaded areas = distributions from Luginbill and Painter, 1953
Figure 58.
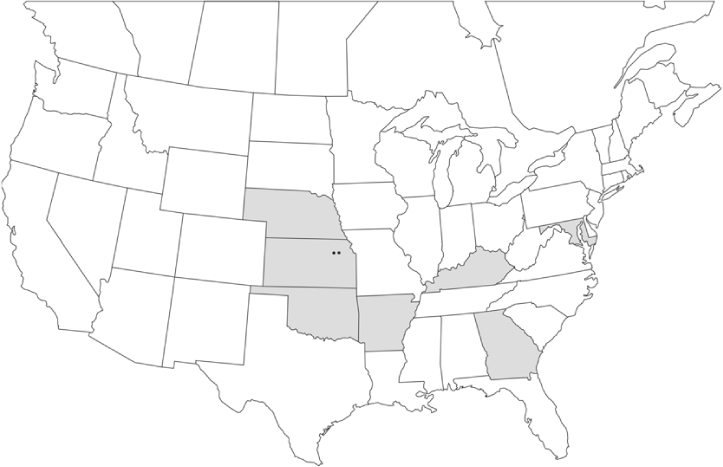
P. sylvatica
• = catch sites, n = 104 beetles
Shaded areas = distributions from Luginbill and Painter, 1953
Figure 60.
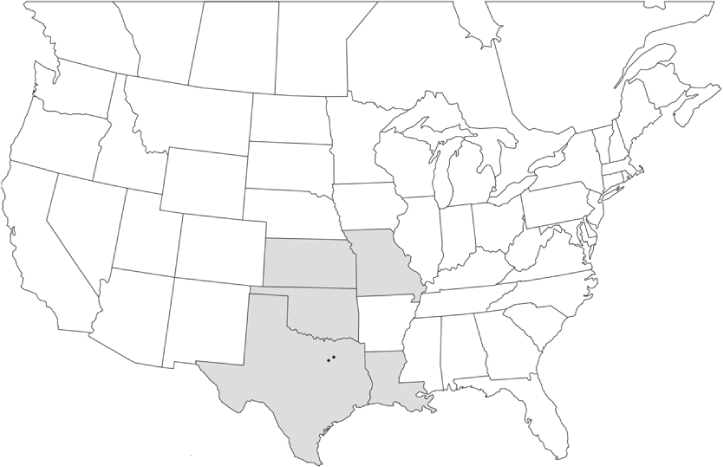
P. torta
• = catch sites, n = 4 beetles
Shaded areas = distributions from Luginbill and Painter, 1953
Figure 61.
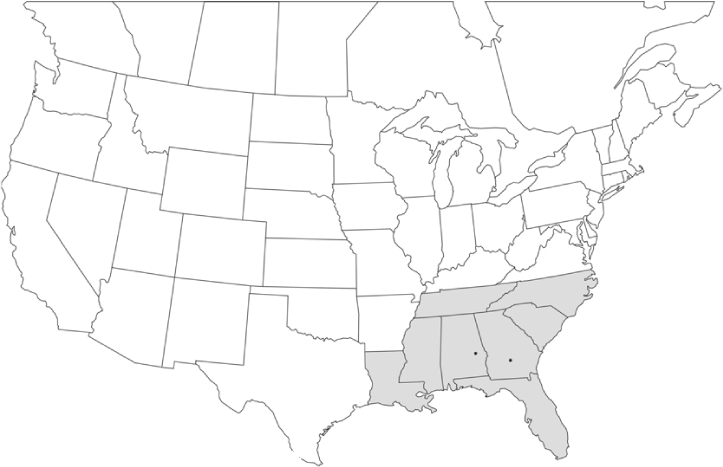
P. ulkei
• = catch sites, n = 2 beetles
Shaded areas = distributions from Luginbill and Painter, 1953
Figure 62.
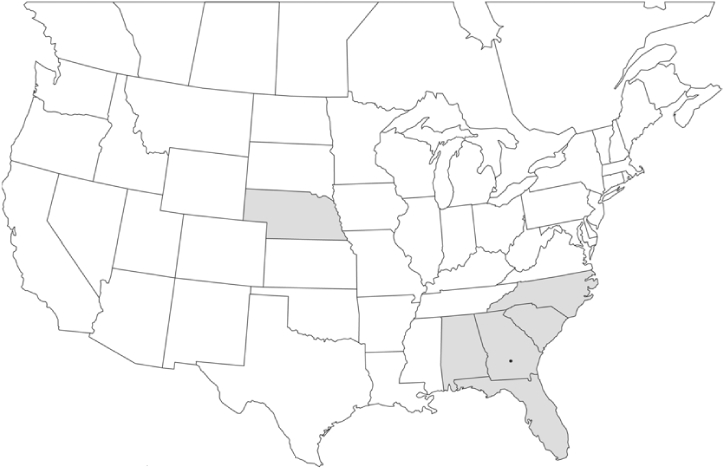
P. uniformis
• = catch sites, n = 872 beetles
Shaded areas = distributions from Luginbill and Painter, 1953
Figure 63.
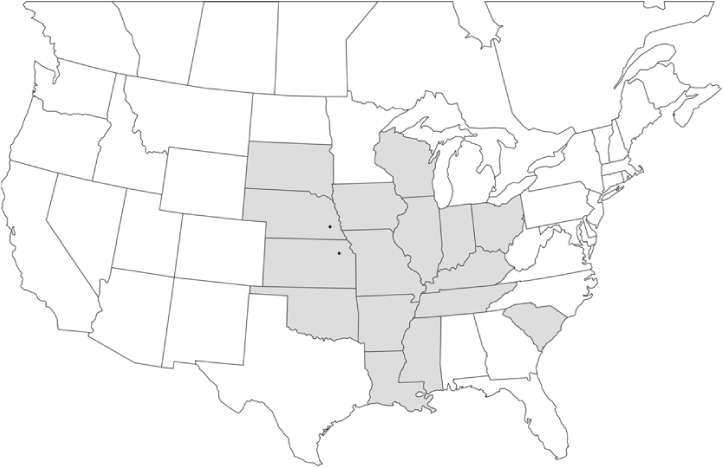
P. vehemens
• = catch sites, n = 79 beetles
Shaded areas = distributions from Luginbill and Painter, 1953
Changes in population levels from year to year within sites
Numbers of beetles of a particular species changed dramatically from year to year at the same trapping location. For example, traps were maintained at the Auburn, Alabama site during the 1997, 1998, and 1999 seasons for approximately the same time period each year. The numbers of P. gracilis captured declined from 1123 in 1997, to 710 in 1998, and to 98 in 1999 (Tables 5, 6, 7). In Lexington, Kentucky, from 1999 to 2000, the numbers of each of the six species captured more than doubled (Tables 29, 30).
Table 5.
Alabama, Auburn 1997
Blends indicate the ratio of the methyl esters of L-valine/L-isoleucine

Table 7.
Alabama, Auburn 1999
Blends indicate the ratio of the methyl esters of L-valine/L-isoleucine

Table 29.
Kentucky, Lexington 1999
Blends indicate the ratio of the methyl esters of L-valine/L-isoleucine

Table 30.
Kentucky, Lexington 2000
Blends indicate the ratio of the methyl esters of L-valine/L-isoleucine

Table 8.
Alabama, Marion Junction 1999
Blends indicate the ratio of the methyl esters of L-valine/L-isoleucine

Table 9.
Alabama, Marion Junction 2000
Blends indicate the ratio of the methyl esters of L-valine/L-isoleucine

Table 10.
Canada, Nova Scotia, Kentville Center 1999
Blends indicate the ratio of the methyl esters of L-valine/L-isoleucine

Table 11.
Canada, Nova Scotia, Kentville Center 2000
Blends indicate the ratio of the methyl esters of L-valine/L-isoleucine

Table 12.
Canada, Ontario, Woodlawn 1999
Blends indicate the ratio of the methyl esters of L-valine/L-isoleucine

Table 13.
Canada, Ontario, Woodlawn 2000
Blends indicate the ratio of the methyl esters of L-valine/L-isoleucine

Table 14.
Connecticut, Vernon 1999
Blends indicate the ratio of the methyl esters of L-valine/L-isoleucine

Table 15.
Connecticut, Vernon 2000
Blends indicate the ratio of the methyl esters of L-valine/L-isoleucine

Table 16.
Florida, Holiday 1998
Blends indicate the ratio of the methyl esters of L-valine/L-isoleucine

Table 17.
Georgia, Athens 1999
Blends indicate the ratio of the methyl esters of L-valine/L-isoleucine

Table 18.
Georgia, Athens 2000
Blends indicate the ratio of the methyl esters of L-valine/L-isoleucine

Table 19.
Georgia, Griffin 1999
Blends indicate the ratio of the methyl esters of L-valine/L-isoleucine

Table 20.
Georgia, Tifton 1999
Blends indicate the ratio of the methyl esters of L-valine/L-isoleucine

Table 21.
Georgia, Tifton 2000
Blends indicate the ratio of the methyl esters of L-valine/L-isoleucine

Table 22.
Iowa, Ames, East Reactor Woods 1999
Blends indicate the ratio of the methyl esters of L-valine/L-isoleucine

Table 23.
Iowa, Ames, East Reactor Woods 2000
Blends indicate the ratio of the methyl esters of L-valine/L-isoleucine

Table 24.
Indiana, West Lafayette 2000
Blends indicate the ratio of the methyl esters of L-valine/L-isoleucine

Table 25.
Kansas, Greensburg #1 2000
Blends indicate the ratio of the methyl esters of L-valine/L-isoleucine

Table 26.
Kansas, Greensburg #2 2001
Blends indicate the ratio of the methyl esters of L-valine/L-isoleucine

Factors affecting the size of the population include not only weather during the flight period, but soil moisture and tilth conditions suitable for oviposition, egg hatch, and growth of larvae during the previous year or years that it takes for development to adults. Quality and quantity of larval host plants, soil textural characteristics, and species' preferences for soil types also factor into population size and distributions (Katovich et al. 1998). Changes in population size of other species at other trapping sites may be seen in Tables 5–97. Species captured at a particular site changed from year to year as well, indicating that multiyear studies will yield a more realistic picture of population sizes and species distributions than will a single year of captures.
Male captures with sex attractants
The most important finding of the present study was the demonstration of the extensive use of the methyl esters of L-valine and L-isoleucine as sex attractants in the mate recognition systems of the Phyllophaga. In 56 discrete locations across the US and Canada, during 94 observation periods (some locations were trapped for multiple years), 61 species of Phyllophaga were captured. The overwhelming majority (58) of these species are found in the Phyllophaga (sensu stricto) subgenus. Since there are 147 species in this subgenus in America north of Mexico (Evans 2003; Smith and Evans 2005), 39% of the species in this group were captured in traps during the course of this study.
Male trap captures are graphically illustrated in Figures 64–126. The figures are arranged alphabetically by Phyllophaga species. Within each species figure, graphs are arranged alphabetically by state or province abbreviation. The graphs demonstrate three general patterns of species-specific male responses to a particular blend or group of blends. The three general patterns are displayed in Figure 127. First, some species, such as P. vehemens, flew primarily to the 100/0 L-valine methyl ester/L-isoleucine methyl ester lure and were sensitive to increasing amounts of L-isoleucine methyl ester in the other blends, its presence significantly reducing captures1. P. congrua, however, had a broader response profile and was captured not only with the 100 % L-valine methyl ester lure, but also with blends containing 10%–20% L-isoleucine methyl ester (Figure 71). A similar situation was seen in responses of male P. hirtiventris (Figure 96). The second case (Figure 127) involved species such as P. forbesi that were captured primarily with the 100% L-isoleucine methyl ester lure. Increasing titers of L-valine methyl ester resulted in reduced or no captures2. In the third case (Figure 127), some species of Phyllophaga, such as P. glabricula, required the presence of both compounds before captures occurred3. An examination of these male- response curves reveals that, whereas certain species had a rather broad response range to the L-valine methyl ester/L-isoleucine methyl ester blends,4 others exhibited response curves occupying a narrower range of blends5.
Figure 64.

P. aemula ♂ catches
Figure 127.
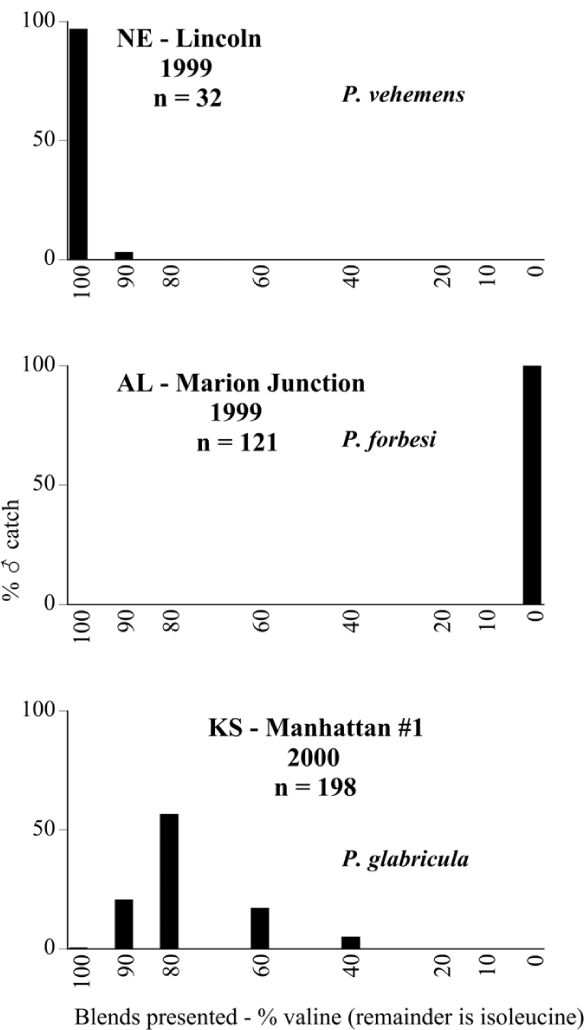
Response curves of ♂ Phyllophaga to sex attractants.
Figure 71.
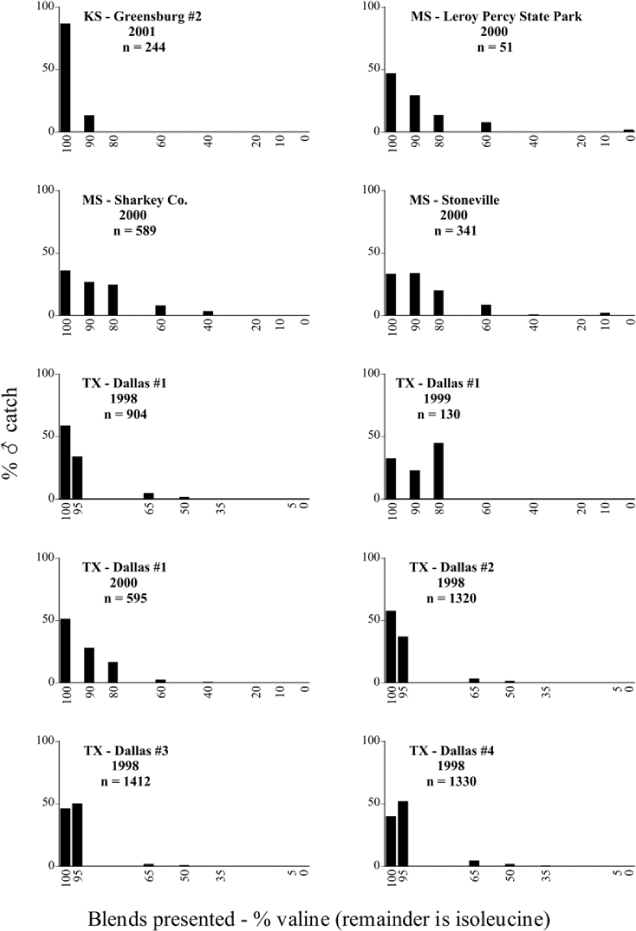
P. congrua ♂ catches
Figure 96.
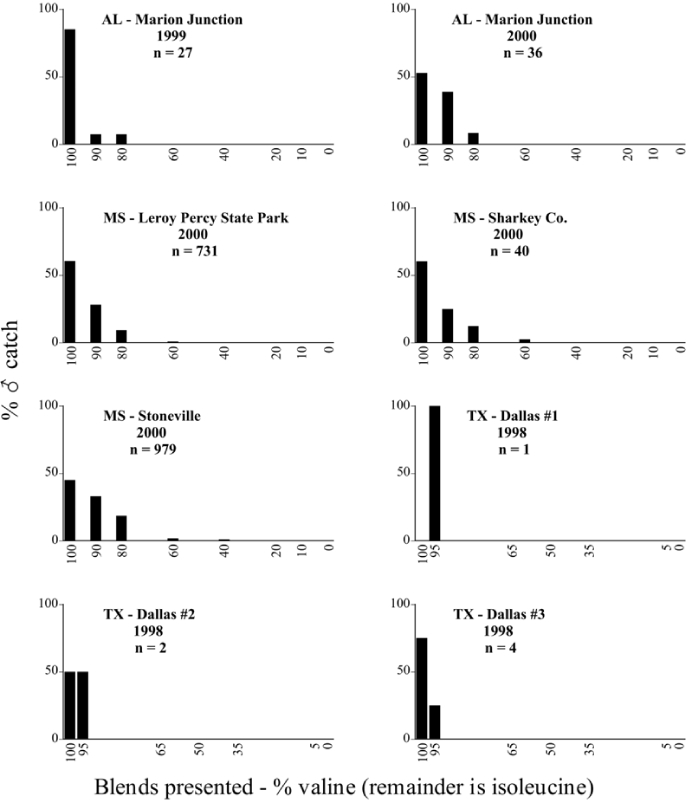
P. hirtiventris ♂ catches
Figure 65.

P. ajjabilis ♂ catches
Specificity of response over time and space
A striking aspect of the intra-specific male flight responses to the sex attractants was their consistency between years and across geographic locations. Several species were recorded at only one site, but were captured at that site for two consecutive years6. The response profiles for each species in both years at those sites were nearly identical.
The majority of Phyllophaga species were recorded at more than one site (Tables 4a and 4b). As with the across-years comparison above, the intra-specific male-response curves from different geographic locations are similar as well. For instance, only five specimens of P. balia were captured during this study, but they were captured at three different locations (Figure 6) and all with the 100% L-isoleucine methyl ester lure (Figure 68). Nearly 7000 P. congrua were captured at eight different sites (Figure 9) and all sites exhibited similar response curves (Figure 71). Comparable results are seen when other species are examined7.
Figure 6.
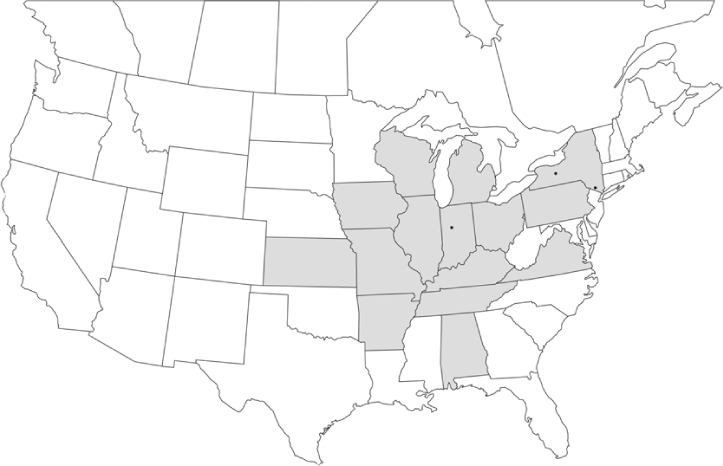
P. balia
• = catch sites, n = 5 beetles
Shaded areas = distributions from Luginbill and Painter, 1953
Figure 68.
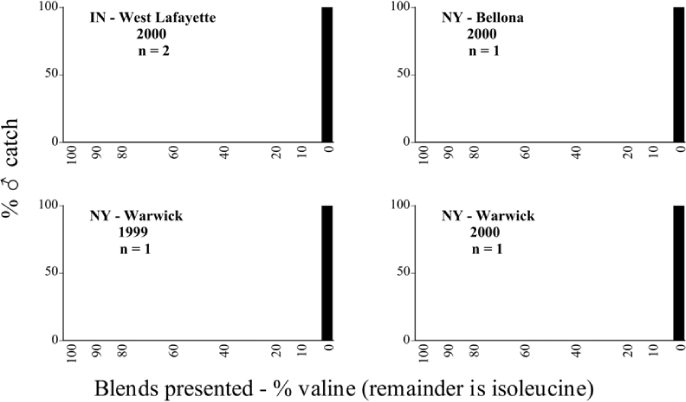
P. balia ♂ catches
Figure 9.
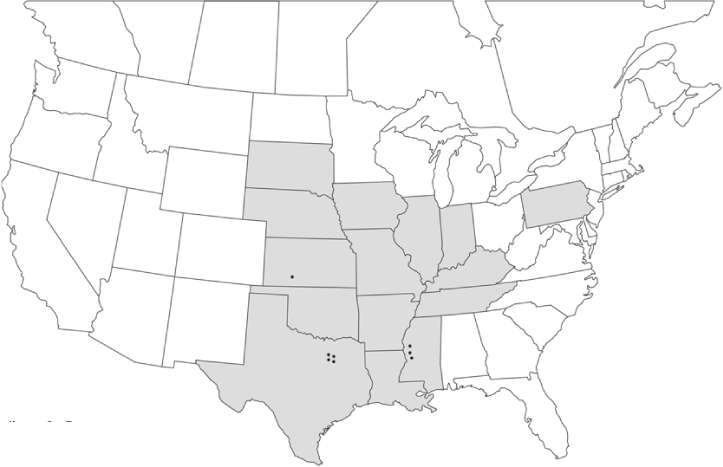
P. congrua
•= catch sites, n = 6916 beetles
Shaded areas = distributions from Luginbill and Painter, 1953
Some species were captured at only one location and only during a single year, but multiple catches over time in the same or nearby blends furnish a series of independent observations that support responses to a particular lure despite the small numbers. For instance, six specimens of P. davisi Langston were captured in Marion Junction, Alabama in 1999, all in traps baited with the 100% L-isoleucine methyl ester lure (Figure 77) on six different dates between 4/5 and 4/28. P. davisi is a species that Luginbill and Painter (1953) indicate is rare, with “Only a few specimens seen.”
Figure 77.
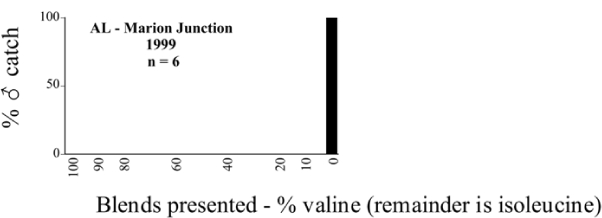
P. davisi ♂ catches
In Auburn, AL in 1998 two specimens of P. diffinis (Blanchard) were captured with the 100% L-valine methyl ester lure (Figure 78) - one taken on 4/16 and one taken on 4/21.
Figure 78.
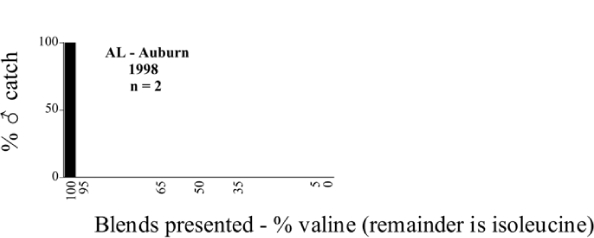
P. diffinis ♂ catches
Another uncommon species, P. (Phytalus) georgiana Horn, was captured in Tifton, Georgia, in 2000. Two individuals of this species flew to the 100% L-valine methyl ester lure (Figure 89), one on 7/17 and one on 7/21. Woodruff and Beck (1989) report that no adult host plants are recorded, the larva is undescribed, and the life cycle is unknown. This species is one of seven North American species in the subgenus Phytalus. Members of this subgenus can be discriminated from the Phyllophaga (sensu stricto) by their cleft tarsal claws.
Figure 89.
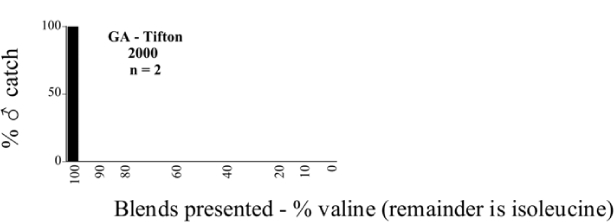
P. (Phytalus) georgiana ♂ catches
P. mariana is reported as a very rare species (Luginbill and Painter 1953). Four specimens were captured in Tifton, Georgia, in 2000 and 2001, on four different dates, in traps baited with the 90/10 or 80/20 L-valine methyl ester/L-isoleucine methyl ester blends (Figure 107).
Figure 107.
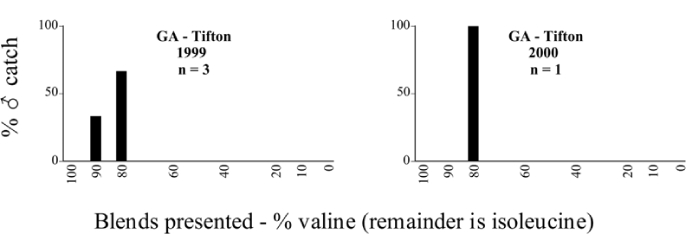
P. mariana ♂ catches
Two specimens of P. taxodii Langston were captured in Louisiana in 1997 in the 35/65 L-valine methyl ester/L-isoleucine methyl ester blend (Figure 122), one on 7/3 and the other on 8/15. Luginbill and Painter (1953) list this species as uncommon, having been captured only in AL and MS. However, Riley (1988) reports that this species is not frequently taken at lights and that fair numbers have been captured in flight-intercept traps 50 feet above the ground in cypress stands. Riley concludes that a lack of light trap catches gives the impression of rarity but that the method of collection may be more important.
Figure 122.
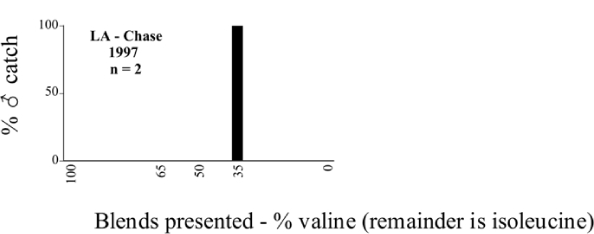
P. taxodii ♂ catches
Similarly, R. J. Bauernfiend in Manhattan, Kansas indicated that in many years of light trapping he had never captured P. sylvatica, and was surprised to capture 104 individuals of this species during two years of sex attractant trapping (Figure 121).
Figure 121.
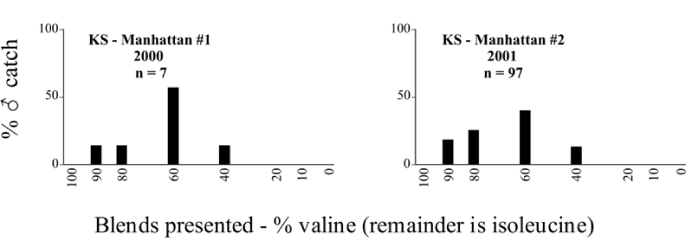
P. sylvatica ♂ catches
Of some interest is the capture of both P.gracilis and P.gracilis variety angulata in traps baited with 100% L-isoleucine methyl ester (Figures 92 and 93). Woodruff and Beck (1989) indicate that “The exact status of this form (angulata) awaits further study”. The different forms of the male genitalia easily separate these populations of P. gracilis. Photos of the two genitalic forms can be seen in Luginbill and Painter (1953). The two forms are sympatric over a large range (Figures 29 and 30). Langston (1927) provides illustrations of the genitalia indicating what appears to be a form intermediate between P. gracilis and P. gracilis variety angulata.
Figure 92.
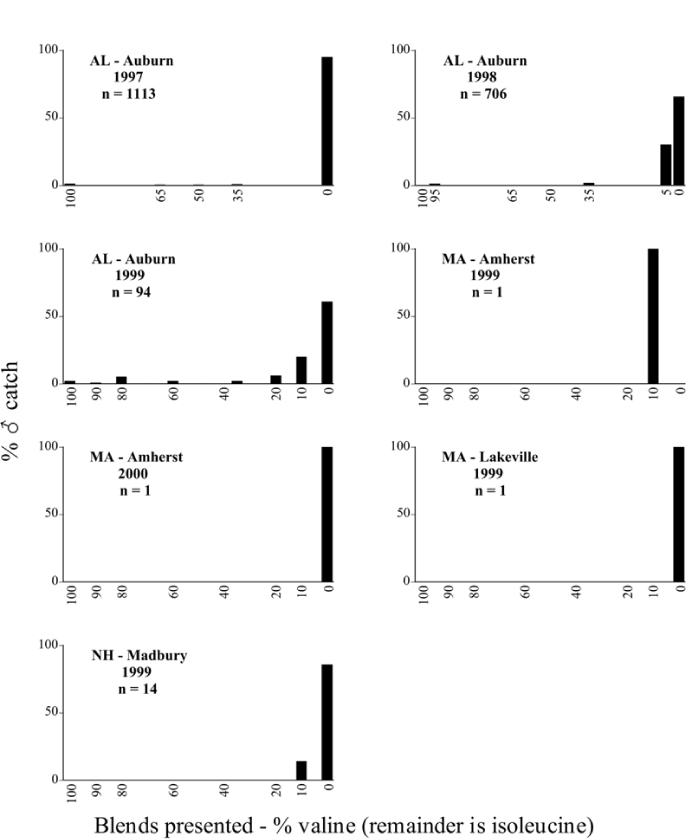
P. gracilis ♂ catches
Figure 93.

P. gracilis var. angulata ♂ catches
Intra-location species interactions
The location tables (Tables 5–97) list the blends presented at each site in a particular trapping year and the numbers of Phyllophaga captured with each blend. At each site, the listed species are, by definition, sympatric. At some sites, sympatric species displayed asynchronous flight patterns, including species captured days, weeks, or in some cases, months apart. At other sites, different species of Phyllophaga were synchronic as well as sympatric, but may or may not have been captured with the same sex attractant blends. The distinction of whether males of different species were or were not captured in the same blends is important because it can aid in identifying locations where inter-specific competition for pheromonal space may be occurring. Congeneric males flying to the same sex attractant blends indicate situations where there is potential for inter-specific mating interactions that afford opportunities for investigation into reproductive isolation involving additional species-specific sex attractant compounds, close-range mating behavior, and/or mating at different times.
Table 31.
Louisiana, Chase 1997
Blends indicate the ratio of the methyl esters of L-valine/L-isoleucine

Table 32.
Massachusetts, South Amherst 1999
Blends indicate the ratio of the methyl esters of L-valine/L-isoleucine

Table 33.
Massachusetts, South Amherst 2000
Blends indicate the ratio of the methyl esters of L-valine/L-isoleucine

Table 34.
Massachusetts, Carver 1996
Blends indicate the ratio of the methyl esters of L-valine/L-isoleucine

Table 35.
Massachusetts, Carver 1998
Blends indicate the ratio of the methyl esters of L-valine/L-isoleucine

Table 36.
Massachusetts, Carver 1999
Blends indicate the ratio of the methyl esters of L-valine/L-isoleucine

Table 37.
Massachusetts, Carver 2000
Blends indicate the ratio of the methyl esters of L-valine/L-isoleucine

Table 38.
Massachusetts, Lakeville 1999
Blends indicate the ratio of the methyl esters of L-valine/L-isoleucine

Table 39.
Massachusetts, Lakeville 2000
Blends indicate the ratio of the methyl esters of L-valine/L-isoleucine

Table 40.
Massachusetts, Plympton #1 1996
Blends indicate the ratio of the methyl esters of L-valine/L-isoleucine

Table 41.
Massachusetts, Plympton #2 1996
Blends indicate the ratio of the methyl esters of L-valine/L-isoleucine

Table 42.
Maine, Lincolnville Center 1999
Blends indicate the ratio of the methyl esters of L-valine/L-isoleucine

Table 43.
Maine, Lincolnville Center 2000
Blends indicate the ratio of the methyl esters of L-valine/L-isoleucine

Table 44.
Minnesota, St. Paul #1 1999
Blends indicate the ratio of the methyl esters of L-valine/L-isoleucine

Table 45.
Minnesota, St. Paul #1 2000
Blends indicate the ratio of the methyl esters of L-valine/L-isoleucine

Table 46.
Minnesota, St. Paul #2 2000
Blends indicate the ratio of the methyl esters of L-valine/L-isoleucine

Table 47.
Mississippi, Leroy Percy State Park 2000
Blends indicate the ratio of the methyl esters of L-valine/L-isoleucine

Table 48.
Mississippi, Sharkey County, 5 miles SE of Anguilla 2000
Blends indicate the ratio of the methyl esters of L-valine/L-isoleucine

Table 49.
Mississippi, Stoneville 2000
Blends indicate the ratio of the methyl esters of L-valine/L-isoleucine

Table 50.
Nebraska, Lincoln 1998
Blends indicate the ratio of the methyl esters of L-valine/L-isoleucine

Table 51.
Nebraska, Lincoln 1999
Blends indicate the ratio of the methyl esters of L-valine/L-isoleucine

Table 52.
Nebraska, Lincoln 2000
Blends indicate the ratio of the methyl esters of L-valine/L-isoleucine

Table 53.
New Hampshire, Madbury 1999
Blends indicate the ratio of the methyl esters of L-valine/L-isoleucine

Table 54.
New Hampshire, Madbury 2000
Blends indicate the ratio of the methyl esters of L-valine/L-isoleucine

Table 55.
New Jersey, Chatsworth #1 1996
Blends indicate the ratio of the methyl esters of L-valine/L-isoleucine

Table 56.
New Jersey, Chatsworth #1 1998
Blends indicate the ratio of the methyl esters of L-valine/L-isoleucine

Table 57.
New Jersey, Chatsworth #1 1999
Blends indicate the ratio of the methyl esters of L-valine/L-isoleucine

Table 58.
New Jersey, Chatsworth #2 1998
Blends indicate the ratio of the methyl esters of L-valine/L-isoleucine

Each of the three scenarios (1. sympatric and synchronically flying species captured using different blends; 2. sympatric and asynchronically flying species captured using the same blend; 3. sympatric and synchronically flying species captured using the same blend) were encountered in the course of this study, individually as well as in combination at different study sites. The following examples illustrate the three scenarios.
- In Lexington, Kentucky, in 1999, both P. futilis and P. rugosa flew synchronically between 5/10 and 7/7, but were captured in traps baited with different blends of L-valine methyl ester/L-isoleucine methyl ester (Figure 128).
- In Lincoln, Nebraska, in 1999, both P. vehemens and P. crenulata were captured in the trap baited with the 100% L-valine methyl ester, but their flight periods were separated by 18 days during which no males of either species were captured. P. vehemens flew from 5/16 through 5/25, whereas P. crenulata flew from 6/12 through 7/5 (Figure 129).
- In Amherst, Massachusetts, in 1999, both P. anxia and P. longispina flew to the 100% L-isoleucine methyl ester lure during the period between 5/18 and 6/15 (Figure 130). This latter scenario is the most engaging because it is in this case that the potential for conflict in terms of pheromonal space arises.
Figure 128.
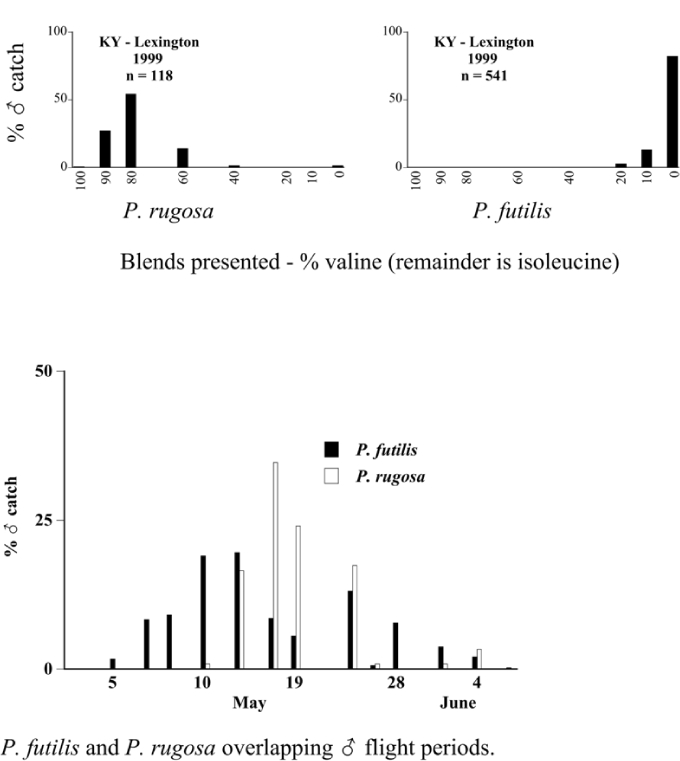
Sympatric Phyllophaga species flying synchronically to different blends of valine/isoleucine. Kentucky, Lexington, 1999.
Figure 129.
Sympatric Phyllophaga species flying asynchronically to the same pheromone. Nebraska, Lincoln, 1999.
Figure 130.
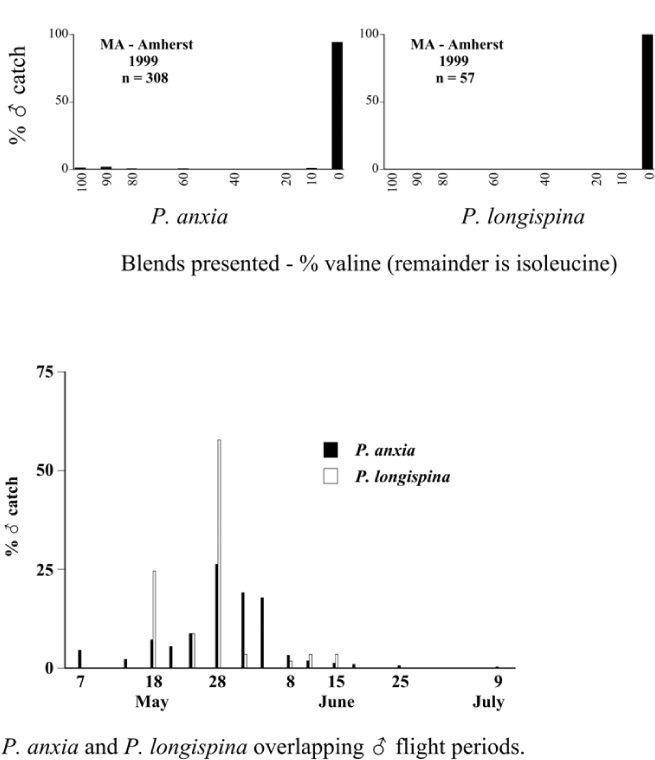
Sympatric Phyllophaga species flying synchronically to the same pheromone. Massachusetts, South Amherst, 1999.
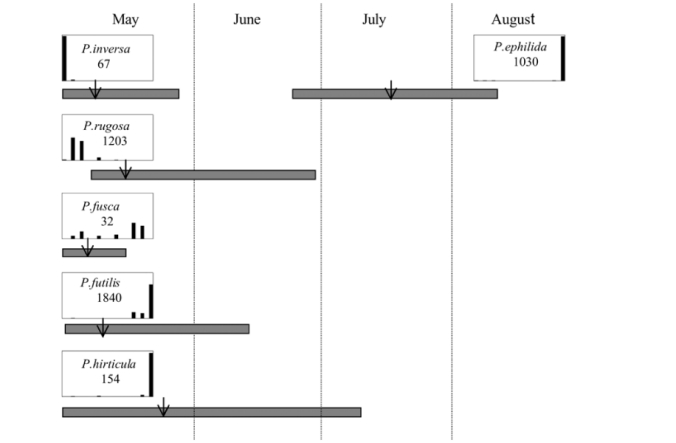
From the male capture data at the various trapping sites, many examples of different species flying synchronically, sympatrically, and to the same blends or blend groupings have been documented. However, nothing is known about whether these species fly at different times of the night or how close-range courtship behaviors are involved in mate recognition. Figures 131–133 display detailed information relating male response specificity curves and time of flight from three sites that demonstrate the complexity of interactions that can occur over a season. Figure 131 (KS Manhattan #2, 2001), demonstrates that P. inversa and P. vehemens flew synchronically to the 100% L-valine methyl ester lure. Similarly, there is potential for interaction between P. rubiginosa and P. sylvatica (middle L-valine methyl ester/L-isoleucine methyl ester blends), P. crassissima and P. fusca (lower L-valine methyl ester/L-isoleucine methyl ester blends), and P. futilis and P. bipartitia (100% L-isoleucine methyl ester lure). In the July and August flights at the same site, P. glabricula, P. affabilis, and P. ephilida were captured synchronically, but with different blends. Figure 132 (KY Lexington, 2000) shows that P. futilis and P. hirticula flew synchronically to the 100% L-isoleucine methyl ester lure, whereas P. ephilida was captured with the same lure, but later in the season. In Figure 133 (MA Amherst, 1999), synchronic species P. forsteri, P. fraterna, and P. fusca displayed overlapping male response curves to L-valine methyl ester/L-isoleucine methyl ester mixes, whereas P. anxia, P. longispina, and P. drakei also flew synchronically to the 100% L-isoleucine methyl ester lure.
Figure 131.
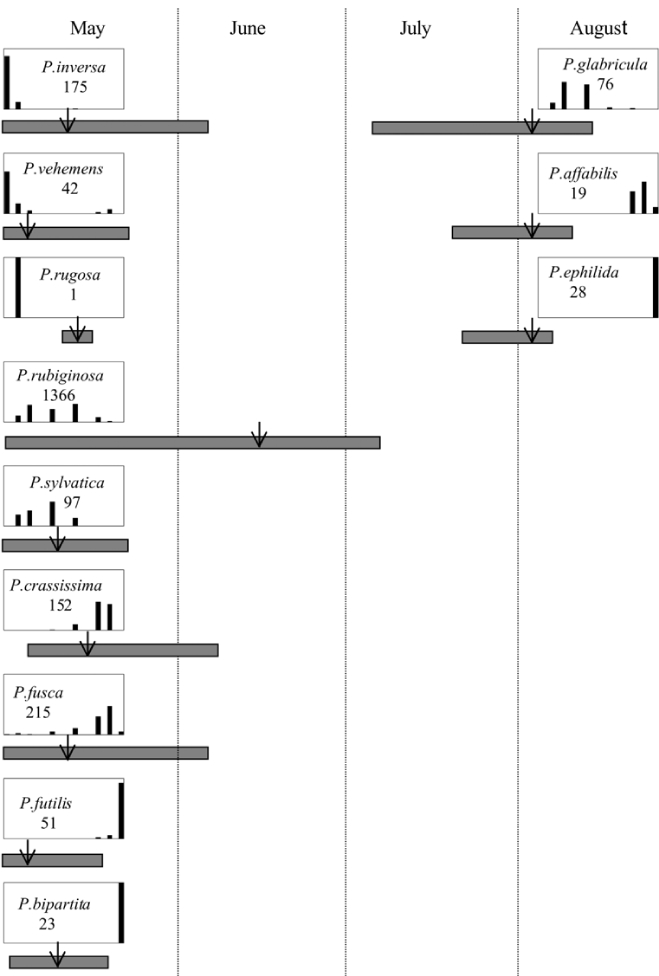
Kansas, Manhattan #2, 2001. Timing and duration of flight and ♂ pheromone response curves. Arrows indicate numerical midpoints of flights.
Figure 132.
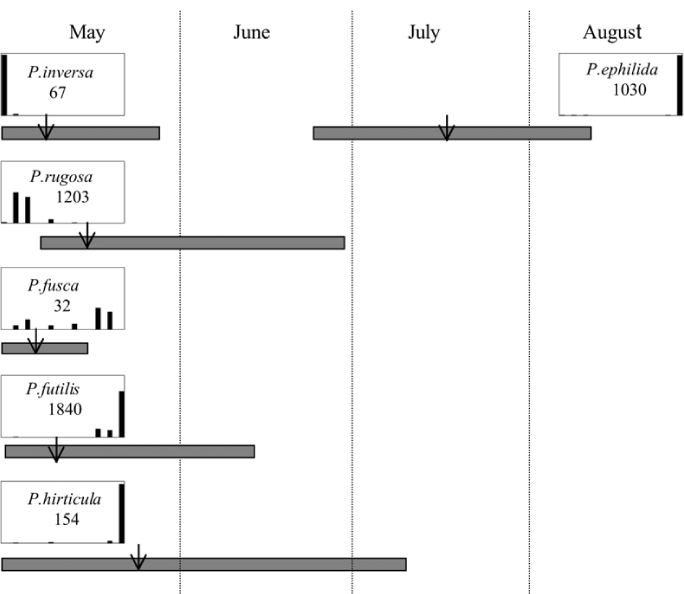
Kentucky, Lexington, 2000. Timing and duration of flight and ♂ pheromone response curves. Arrow indicates numerical midpoint of flight.
Figure 133.
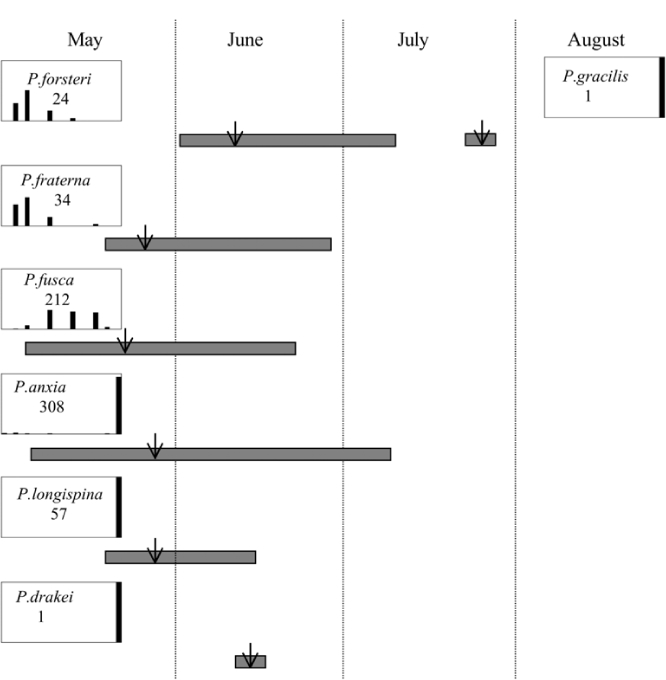
Massachusetts, Amherst, 1999. Timing and duration of flight and ♂ pheromone response curves. Arrow indicates numerical midpoint of flight.
Table 98 outlines, in a briefer format, other trapping locations and the species involved where inter-specific attraction might occur as a result of competition for pheromonal space. However, the possibility of interactions postulated by the overlap of the male response curves in time and space may not necessarily reflect the reality in the field in that females may or may not have a narrower range of sex pheromone blend production than is suggested by what the males are capable of responding to. The potential for inter-specific interactions might be predicted with greater accuracy by combining analysis of blend ratios produced by a number of individual females with knowledge of male captures by various blends and determining if male response curves overlap congeneric female production curves.
Interspecific copulation between Phyllophaga species has been reported in the literature. Fattig (1944) reports (p. 26) that he collected a male P. hirticula copulating with a female P. anxia. Referencing the data from the present study, P. hirticula males were captured in traps baited with the 100% L-isoleucine methyl ester lure (Figure 95). P. anxia males of both the northern and the southern genitalic form were also captured in traps baited with the 100% L-isoleucine methyl ester lure (Figures 66a, 66b, 66c, 66d, 66e and 67). It is likely that the male P. hirticula flew upwind following an L-isoleucine methyl ester plume to find not a conspecific female P. hirticula, but a congeneric female P. anxia. P. hirticula and P. anxia males possess genitalia whose cuticular structures are exceedingly different (see images in Woodruff and Beck, 1989). Their soft sac structures are very different as well (P.S. Robbins, personal observation). Their vestitures also differ, P. anxia being glabrous and P. hirticula being hirsute. Although interspecific genitalic differences could and sometimes do play a role in reproductive isolation of some taxa (Eberhard 1985, Sota and Kubota 1998), genitalic differences clearly did not prevent copulation from taking place in this case.
Figure 95.
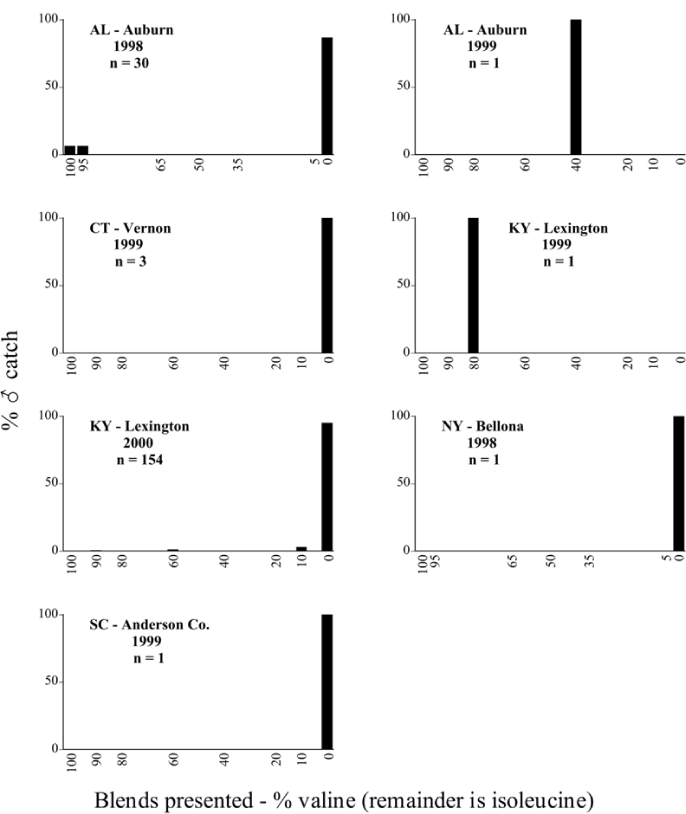
P. hirticula ♂ catches
Figure 66a.
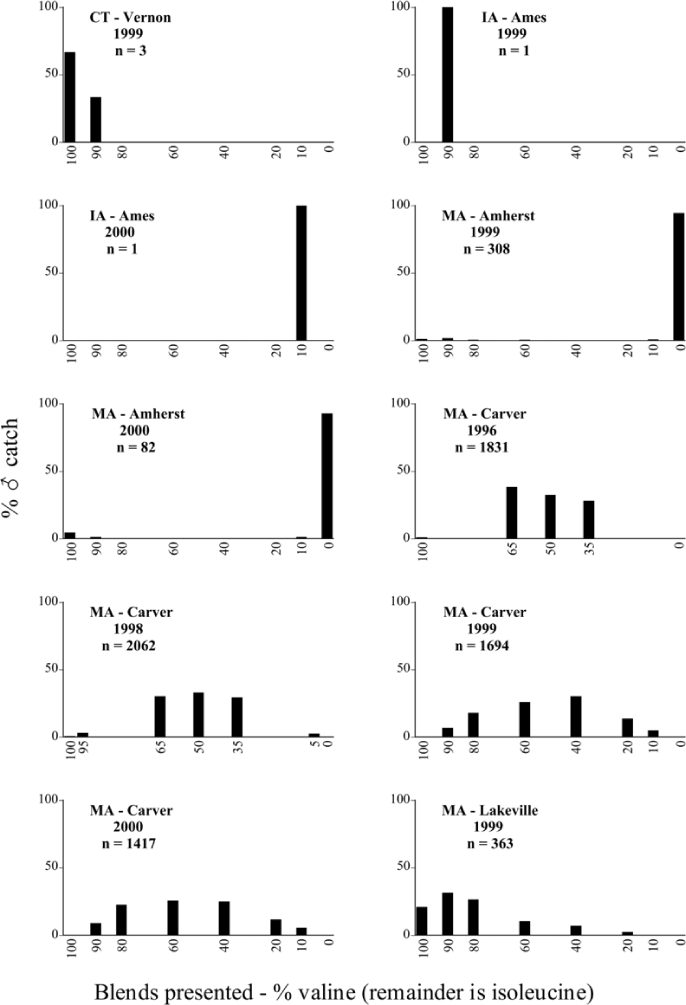
P. anxia (northern genitalic form) ♂ catches
Figure 66b.
P. anxia (northern genitalic form) ♂ catches
Figure 66c.
P. anxia (northern genitalic form) ♂ catches
Figure 66d.
P. anxia (northern genitalic form) ♂ catches
Figure 66e.
P. anxia (northern genitalic form) ♂ catches
Figure 67.
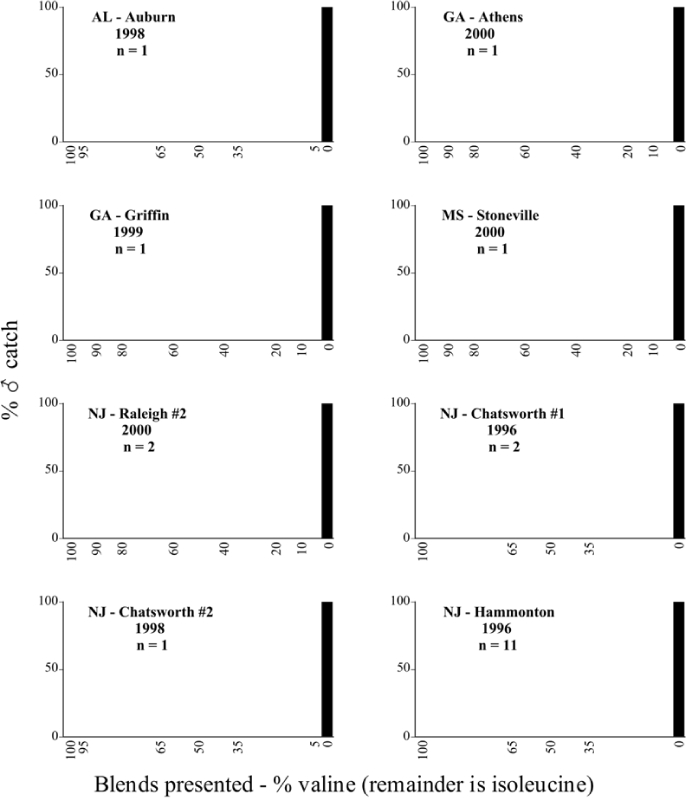
P. anxia (southern genitalic form) ♂ catches
Figure 69.

P. bipartita ♂ catches
Figure 70.
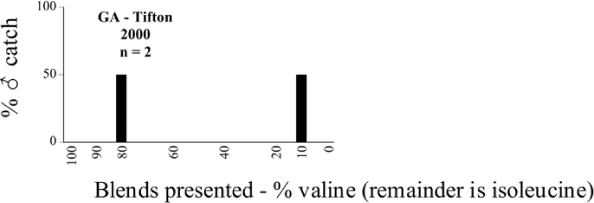
P. clypeata ♂ catches
Figure 72.

P. corrosa ♂ catches
Figure 73a.
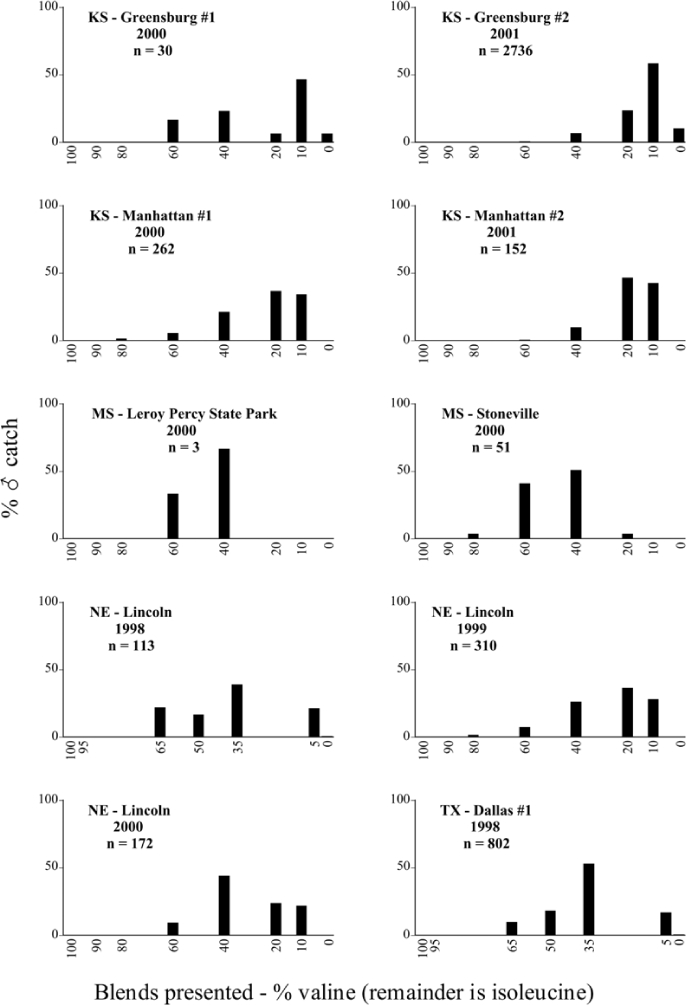
P. crassissima ♂ catches
Figure 73b.
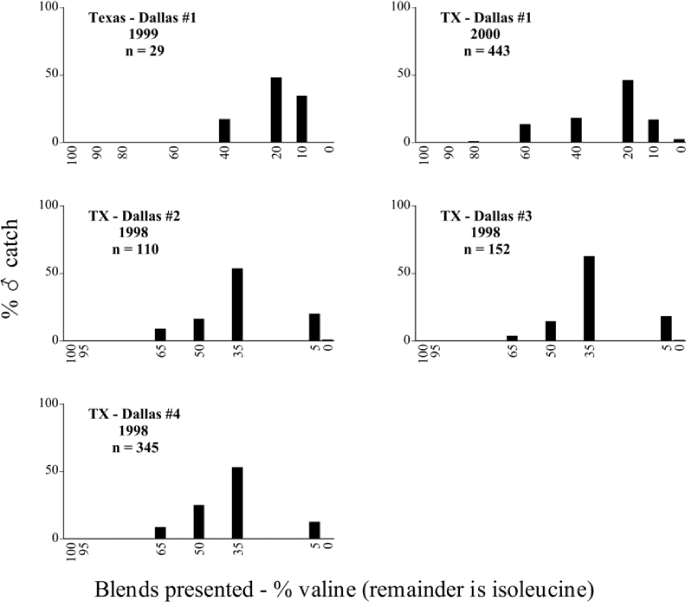
P. crassissima ♂ catches
Figure 74.
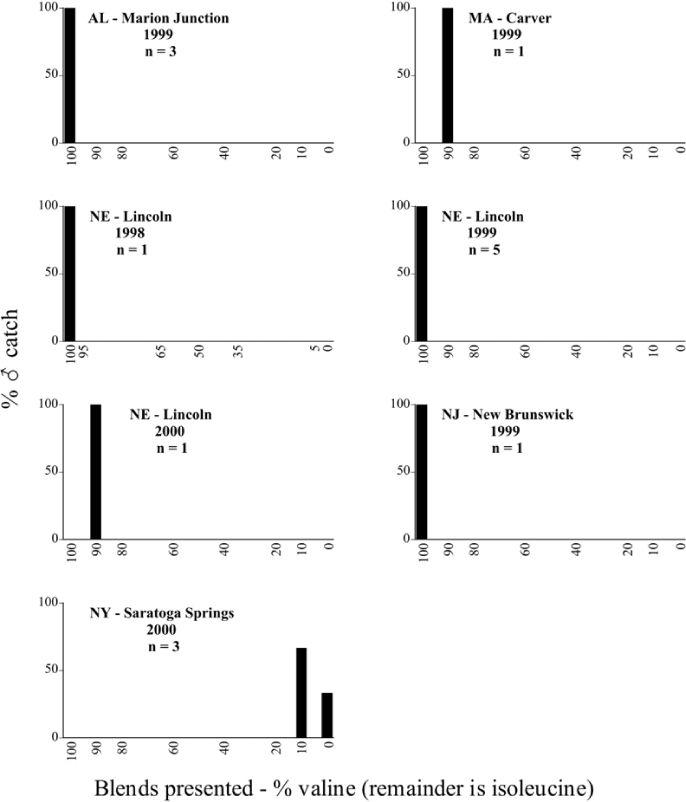
P. crenulata ♂ catches
Figure 75.
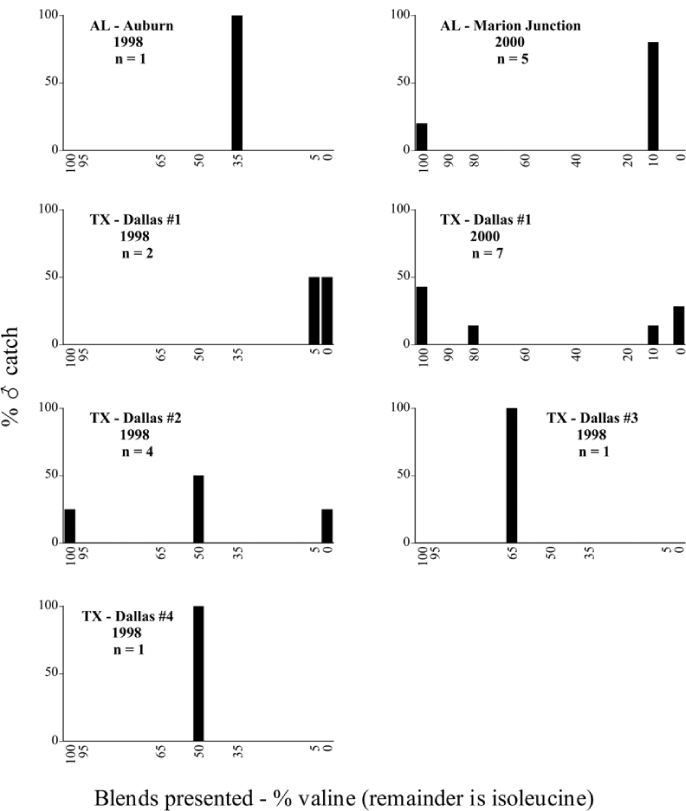
P. crinita ♂ catches
Figure 76.
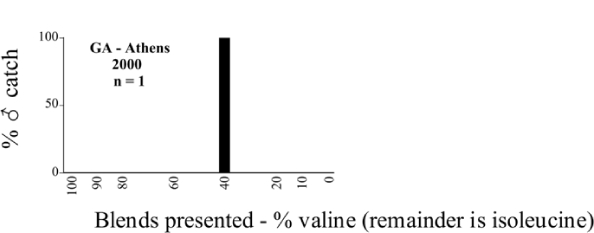
P. curialis ♂ catches
Copulation does not inevitably lead to fertilization or production of offspring (Eberhard 1996), and similarly, attraction to a congeneric Phyllophaga female does not inevitably lead to copulation. In a study from Costa Rica, Eberhard (1993), reporting on the copulatory behavior of several species of Phyllophaga, states of P. vicina, that “Early in the evening solitary females rested immobile and apparently emitted an attractant, as males arrived in flight from downwind. The pheromone apparently also attracted males of P. valeriana, as on three occasions I saw one or more males of this species hover near a female P. vicina (beetles were captured to verify their species identity). One P. valeriana male landed on the female, then immediately took flight and left, suggesting that a second cue, possibly on the beetle's surface, was used to distinguish species identity. Contact pheromones may be used in the melolonthine genus Macrodactylus (Eberhard 1992).” These observations indicate that more studies are needed to clarify the role of morphology and/or contact pheromones in close-range mate recognition in Phyllophaga. Eberhard (1993) reports that “secondary sexual modifications of the sculpturing of the front legs, the ventral bristles, and the overall leg length of male Macrodactylus may function as courtship devices prior to and during copulation”. Although the Phyllophaga are renowned for their extravagant and often asymmetric genitalic morphology, male hind tibial spurs also often assume unique configurations that provide excellent taxonomic characters for species assignments (Luginbill and Painter 1953; Woodruff and Beck 1989; Woodruff and Sanderson 2004). The role tibial spurs play in close-range mate recognition or copulatory courtship in the Phyllophaga is unclear. Males of some Phyllophaga species also have extensive ventral bristles or possess unique morphological characters on the venter, similar to Macrodactylus (P.S. Robbins, personal observation).
Intraspecific variation in male response: P. anxia
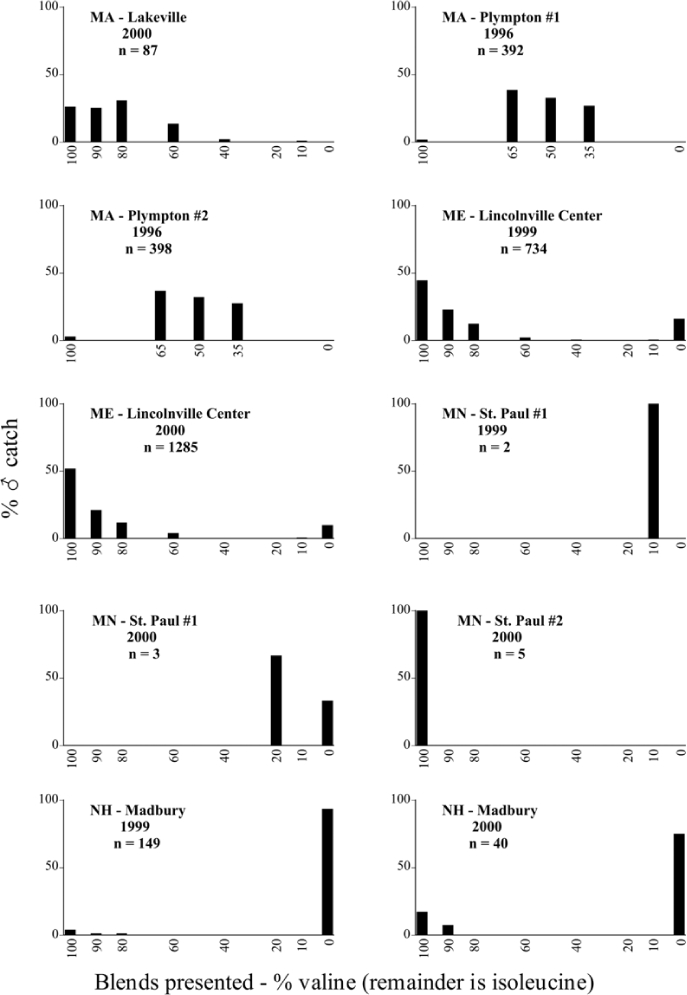
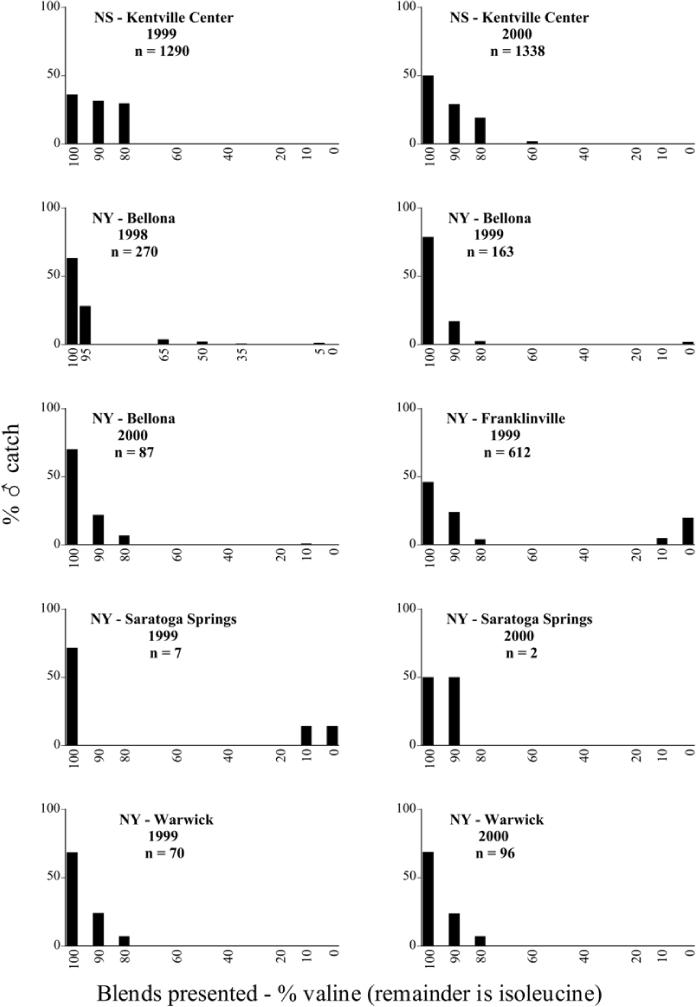
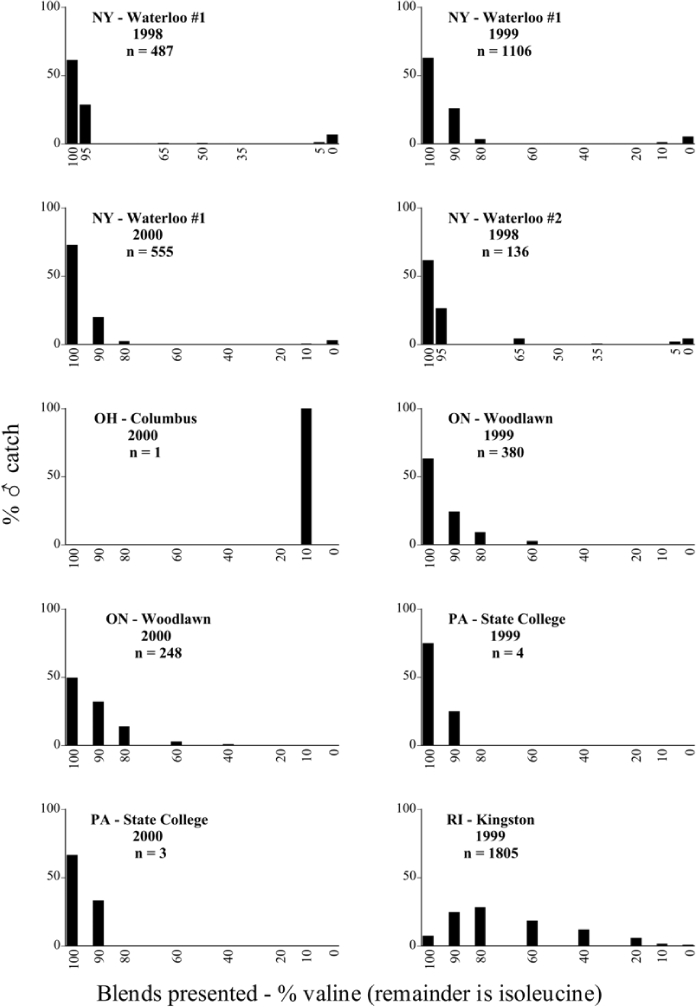
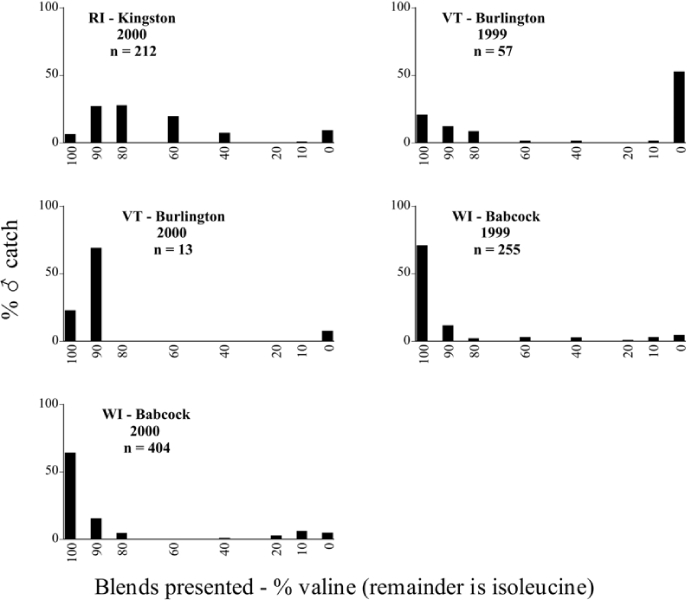
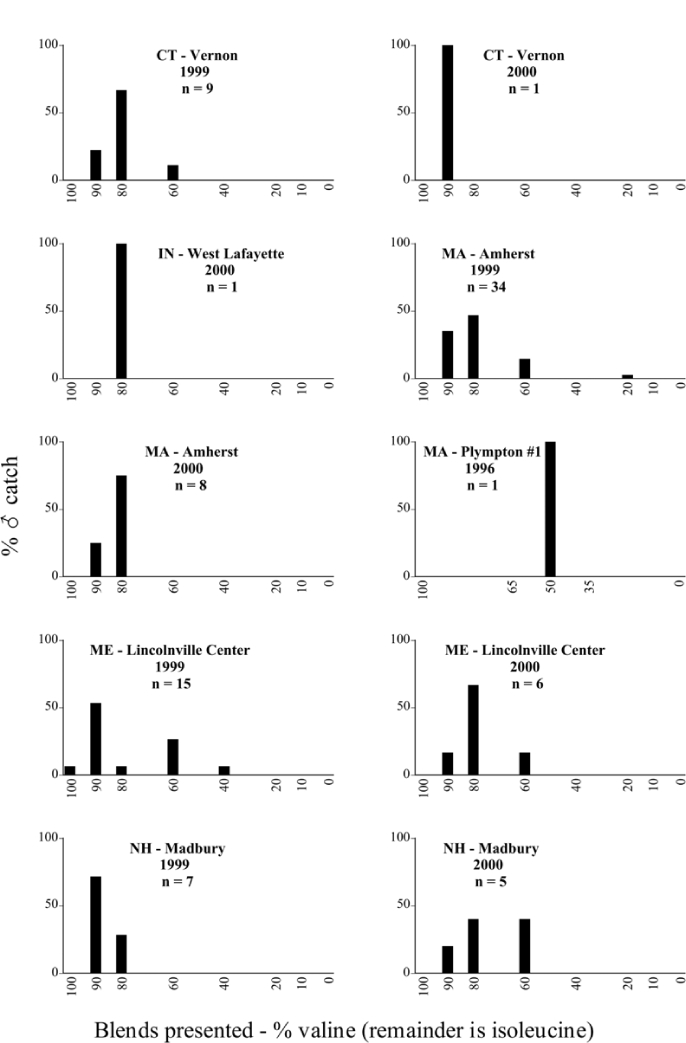
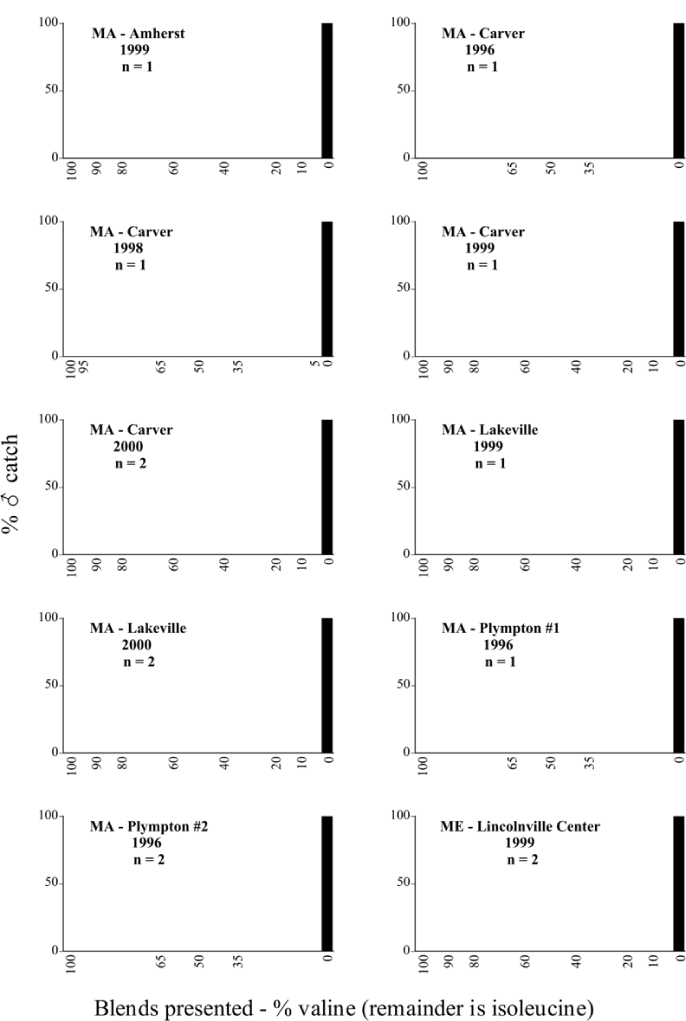
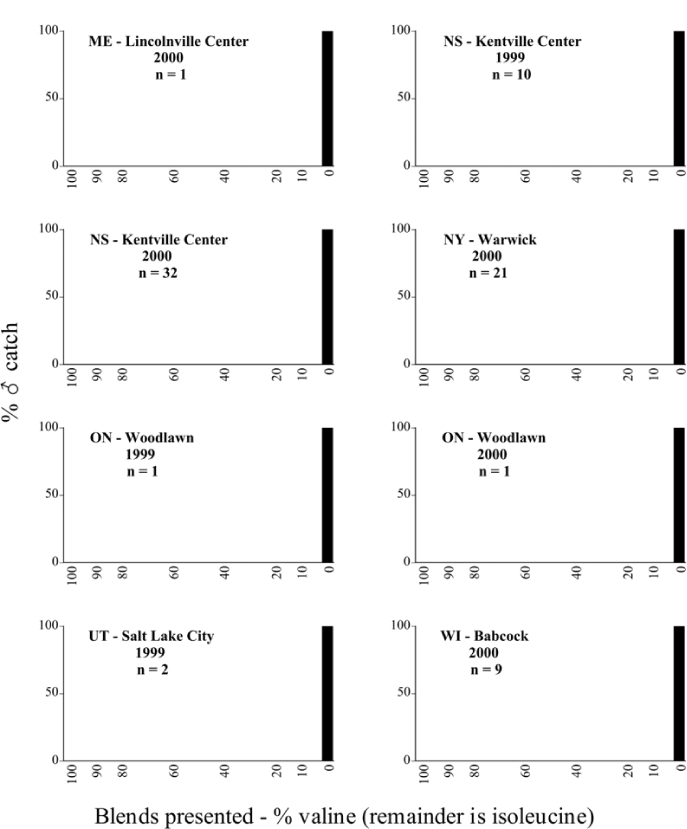
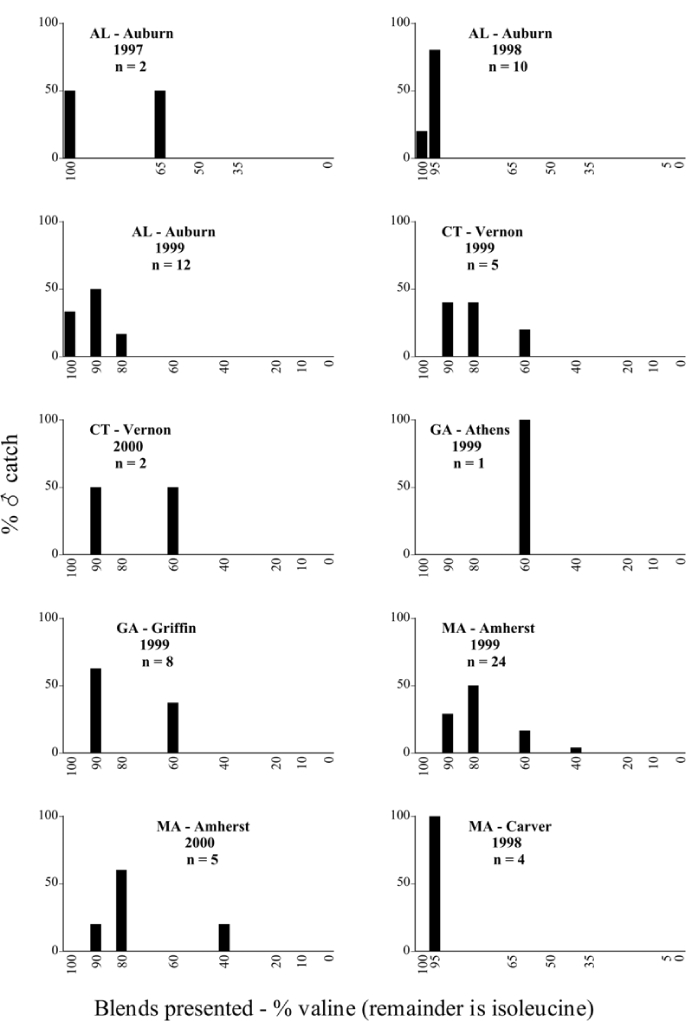
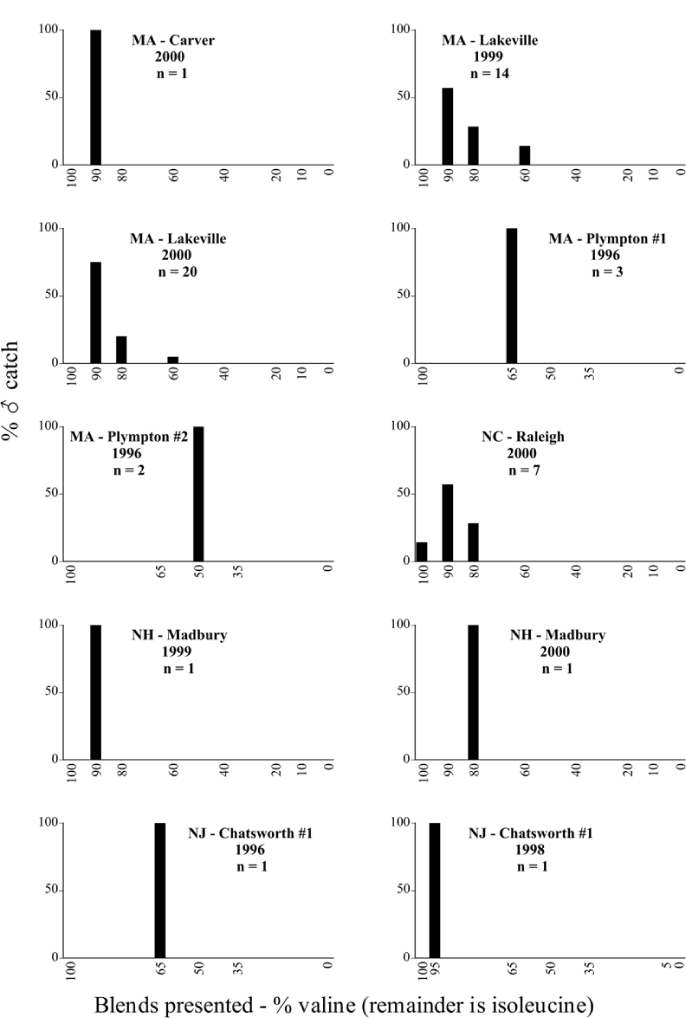
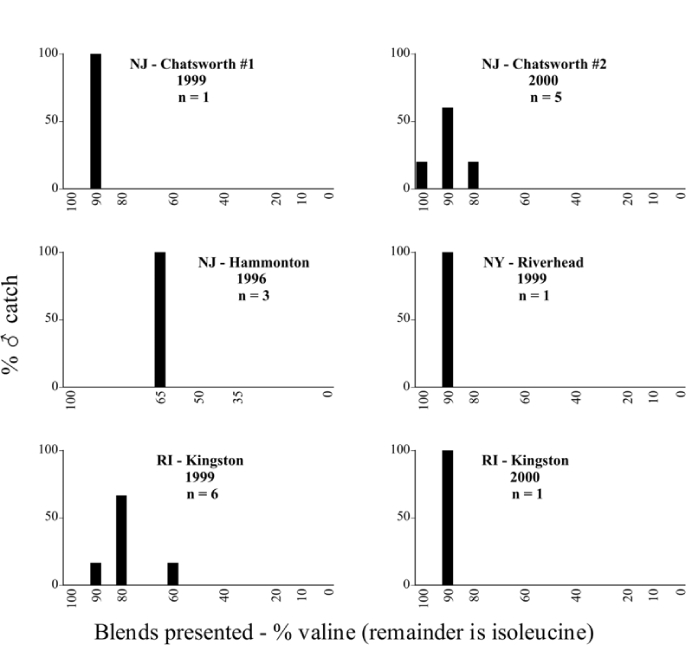
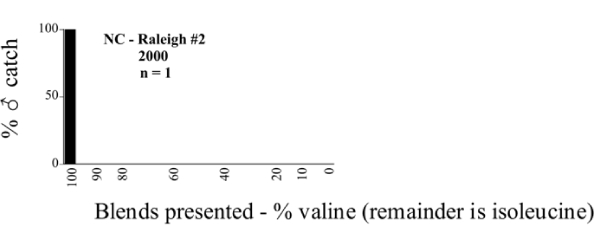
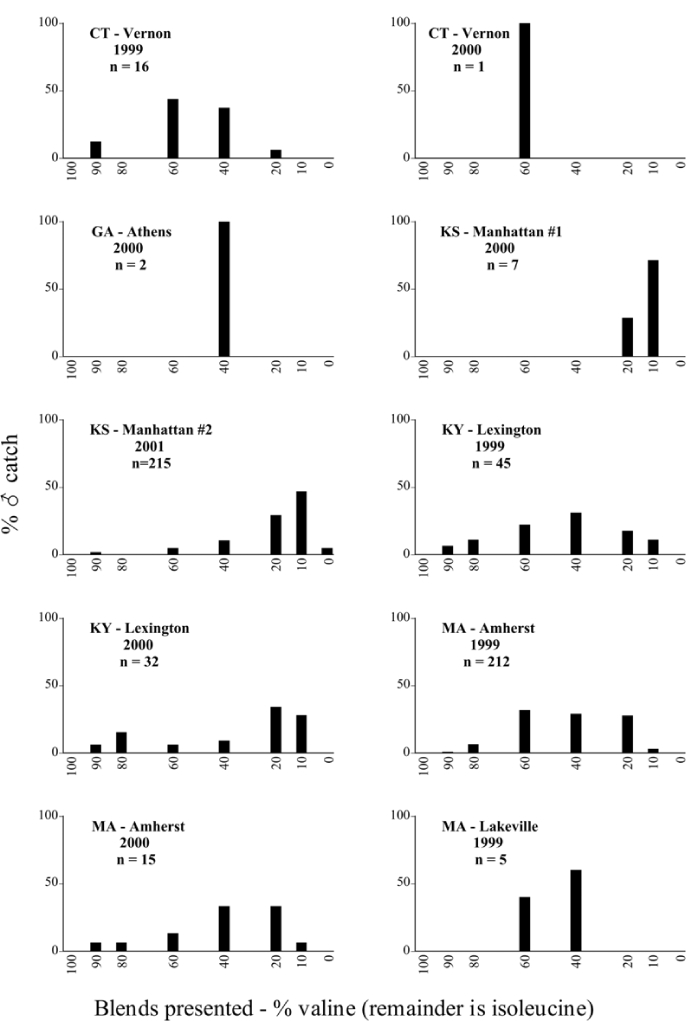
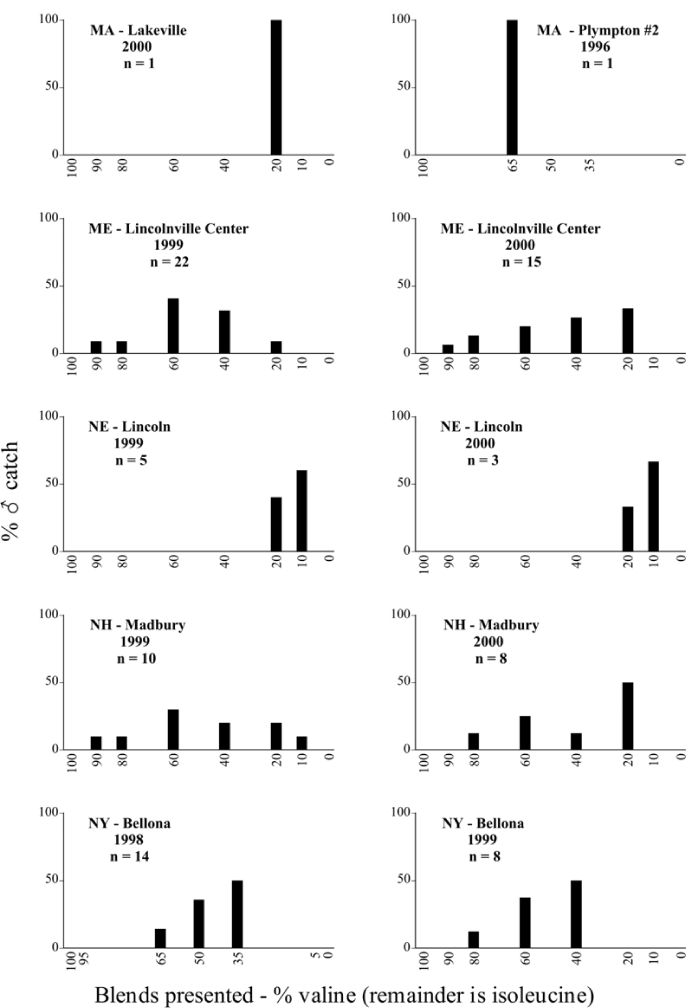
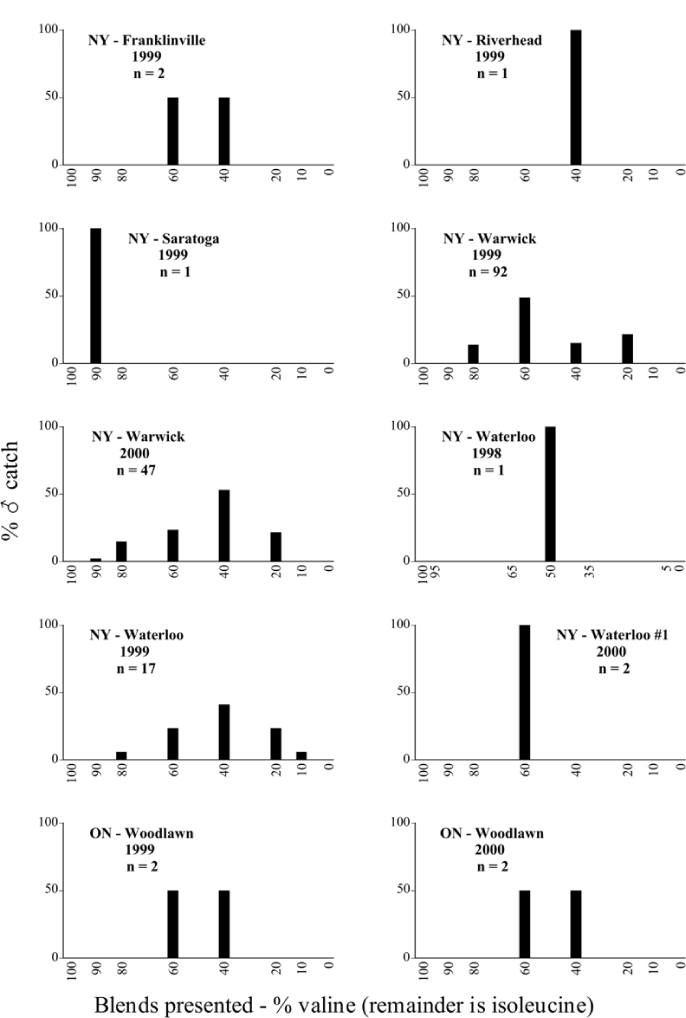
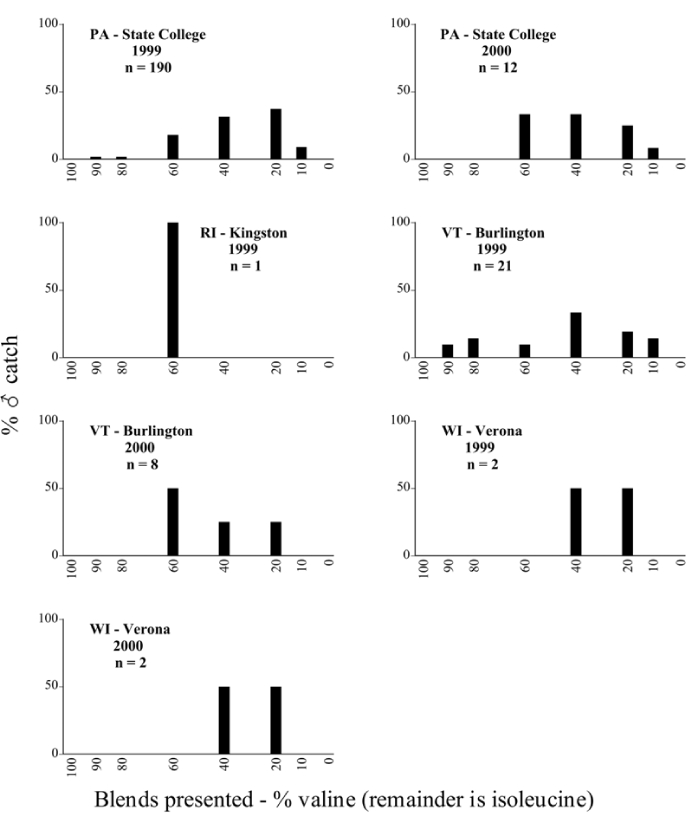
The consistency of intra-specific male responses over space and time that was discussed earlier contrasts with the extensive variation noted in the male-response curves of P. anxia to the various blends of L-valine methyl ester/L-isoleucine methyl ester sex attractants (Figures 66a, 66b, 66c, 66d, and 66e). The variations demonstrated in the male-response profiles of P. anxia are of four general forms:
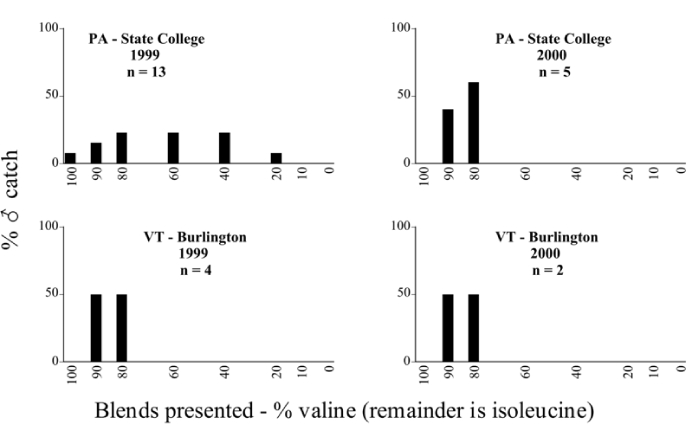
- Those profiles from locations where the males flew primarily to L-valine methyl ester alone (Figure 134 and Figures 66a, 66b, 66c, 66d, and 66e including CT Vernon, 1999; NY Bellona, 1999 and 2000; NY Saratoga Springs, 1999 and 2000; NY Warwick, 1999 and 2000; NY Waterloo #1, 1998 NY Waterloo #1, 1999 and 2000; NY Waterloo #2, 1998; ON Woodlawn, 1999 and 2000; PA State College, 1999 and 2000, WI Babcock, 1999 and 2000)
- Those profiles from locations where the males primarily flew to L-isoleucine methyl ester alone (Figure 135 and Figures 66a, 66b, 66c, 66d, and 66e including MA Amherst, 1999 and 2000; NH Madbury, 1999 and 2000).
- Those profiles from locations where males flew to L-valine methyl ester alone or L-isoleucine methyl ester alone on the same night in the same place (Figure 136 and Figures 66a, 66b, 66c, 66d, and 66e, ME Lincolnville Center, 1999 and 2000; NY Franklinville, 1999; VT Burlington, 1999 and 2000).
- Those profiles from locations where the males were mainly captured in traps baited with blends of L-valine methyl ester and L-isoleucine methyl ester (Figure 137 and Figures 66a, 66b, 66c, 66d, and 66e, MA Carver, 1996 Figure 137 and Figures 66a, 66b, 66c, 66d, and 66e, MA Carver, 1998 Figure 137 and Figures 66a, 66b, 66c, 66d, and 66e, MA Carver, 1999, and 2000; MA Lakeville, 1999 and 2000; MA Plympton #1, 1996; MA Plympton #2, 1996; RI Kingston, 1999 and 2000).
Figure 134.
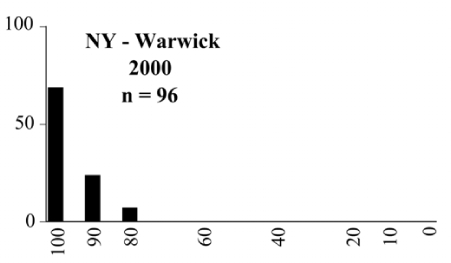
Valine responding ♂ capture curve, P. anxia.
Figure 135.
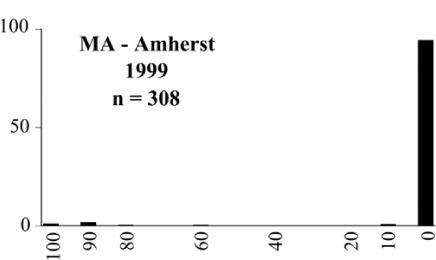
Isoleucine responding ♂ capture curve, P. anxia.
Figure 136.
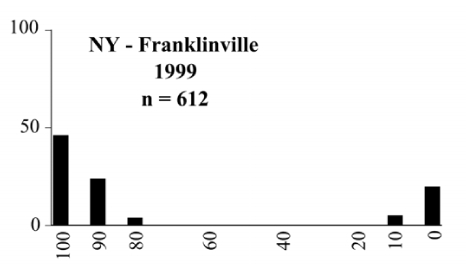
Bimodal ♂ capture curve, P. anxia.
Figure 137.
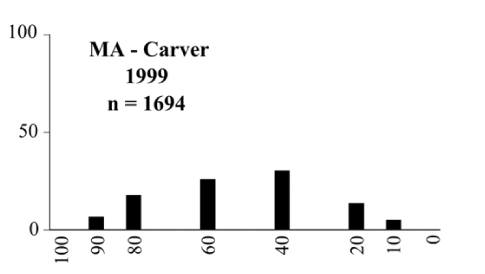
Blend responding ♂ capture curve, P. anxia.
All the P. anxia males from Figures 134 to 137, as well as all other P. anxia males in Figures 66a, 66b, 66c, 66d, and 66e are of the northern genitalic form (Luginbill and Painter 1953; Woodruff and Beck 1989). Male P. anxia of the southern genitalic form (Luginbill and Painter 1953; Woodruff and Beck 1989) were captured exclusively with L-isoleucine methyl ester alone (Figure 67). They were captured in both a smaller number of locations (8 vs.25) and in much smaller numbers (20 vs. 20,640) (Table 2a) than P. anxia males of the northern genitalic form. Unpublished data from studies conducted at the Franklinville, NY, site suggest that L-isoleucine methyl ester responding P. anxia males (both northern and southern genitalic forms) are more sensitive to the presence of L-valine methyl ester than are L-valine methyl ester responding males to the presence of L-isoleucine methyl ester. Male captures in the L-isoleucine methyl ester-baited traps may have been suppressed by the presence of the L-valine methyl ester at the trap sites.
The manner in which the different forms of the P. anxia male sex pheromone response profiles are distributed across North America reveals important information. The five locations yielding response profiles (10 site-years) from P. anxia males that were captured in blends of both L-valine methyl ester and L-isoleucine methyl ester are found only in southeast Massachusetts and Rhode Island (see Figures 66a, 66b, 66c, 66d, and 66e including all the MA Carver, MA Lakeville, MA Plympton #1, MA Plympton #2 and RI Kingston sites). Surrounding these five locations are trapping sites to the west (as far west as Wisconsin) and to the north (as far north as the provinces of Nova Scotia and Ontario) that represent those populations of P. anxia males that responded to only L-valine methyl ester or to only L-isoleucine methyl ester, but did not require a blend of the two for capture (Figure 138). The male response curves generated by the beetle captures at those trapping sites yield a distribution map that is patchy in terms of unequal distributions of the two populations. Some sites harbor only one of the two populations, while other sites hold both, thus generating a bimodal distribution curve.
Figure 138.
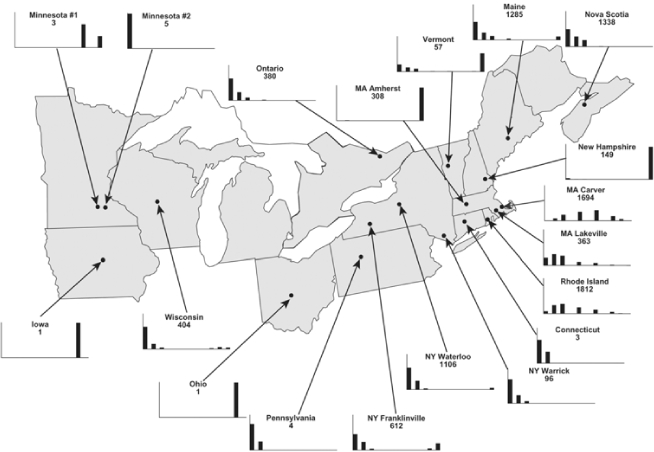
♂ capture curves for Phyllophaga anxia (LeConte), northern genitalic form (n = 20,460. Not all locations shown in this figure.)
A detailed examination (including the soft sacs) of male individuals of the L-valine methyl ester responding populations, the L-isoleucine methyl ester responding populations, and the blend responding populations of P. anxia revealed no character that could be used to differentiate the populations. Further work is planned that will use DNA sequence data from both mitochondrial and nuclear genes to generate gene genealogies with which to document genetic relationships within and among the three races across the US. Microsatellite markers will also be used to characterize allele frequencies in natural populations and consequently estimate the extent of gene exchange among different pheromone races where they occur together and between geographically isolated populations of single pheromone races.
Intra-specific variation in male response: P. fraterna
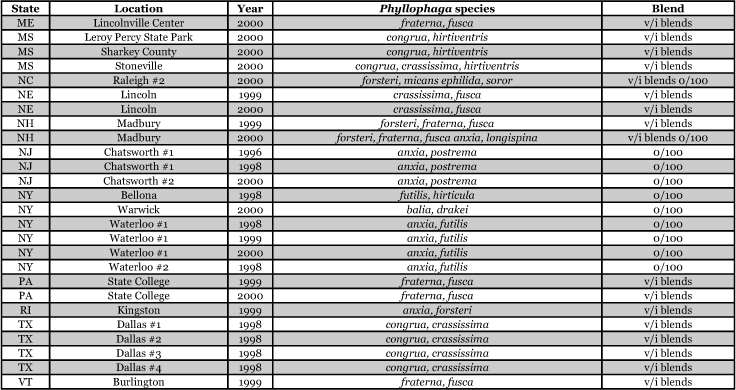
A second instance of intra-specific variation in male response to blends presented was noted at the State College, Pennsylvania, trapping site in 1999 and 2000. Male individuals of a species determined as P. fraterna were captured by two blend groupings in both years (Tables 80 and 81 and Figures 85a, 85b, and 86). In 1999, 18 males were captured with the 0/100 L-valine methyl ester/L-isoleucine methyl ester blend, whereas 13 males were captured with the L-valine methyl ester/L-isoleucine methyl ester mixtures. In 2000, 19 males were captured with the 0/100 L-valine methyl ester/L-isoleucine methyl ester blend whereas 5 males were captured with the L-valine methyl ester/L-isoleucine methyl ester mixtures. Phyllophaga fraterna from locations other than Pennsylvania were captured exclusively in the blends of L-valine methyl ester/L-isoleucine methyl ester (Figures 85a and 85b).
Table 80.
Pennsylvania, State College 1999
Blends indicate the ratio of the methyl esters of L-valine/L-isoleucine

Table 81.
Pennsylvania, State College 2000
Blends indicate the ratio of the methyl esters of L-valine/L-isoleucine

Figure 85a.
P. fraterna ♂ catches
Figure 85b.
P. fraterna ♂ catches
Figure 86.

P. fraterna-like ♂ catches
Figure 79a.
P. drakei ♂ catches
Figure 79b.
P. drakei ♂ catches
Figure 80a.
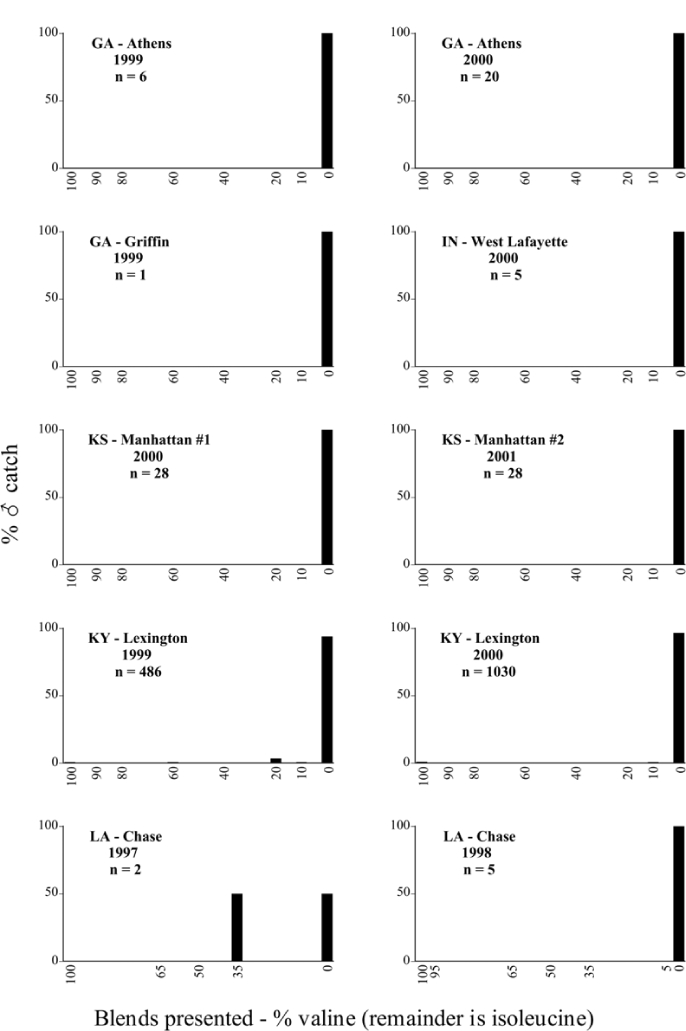
P. ephilida ♂ catches
Figure 80b.
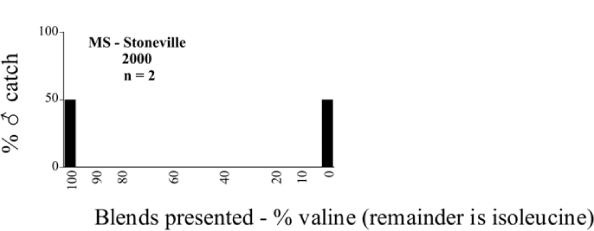
P. ephilida ♂ catches
Figure 81.
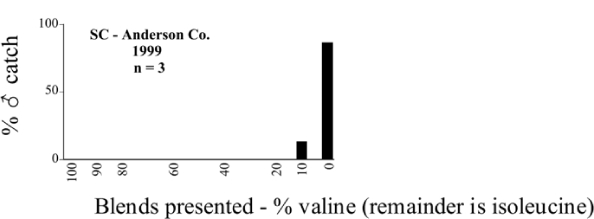
P.fervida ♂ catches
Figure 82.
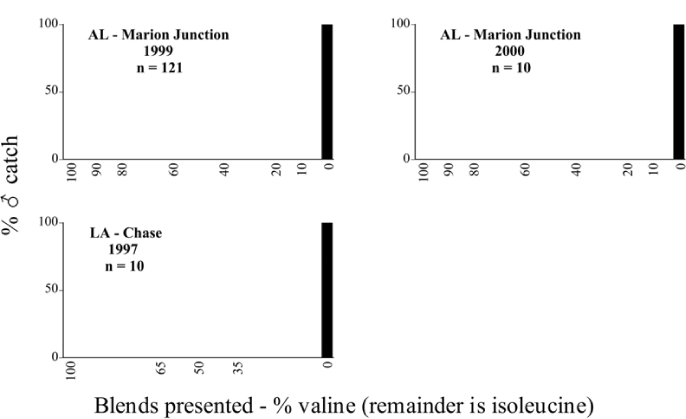
P. forbesi ♂ catches
Figure 83a.
P. forsteri ♂ catches
Figure 83b.
P. forsteri ♂ catches
Figure 83c.
P. forsteri ♂ catches
Figure 84.
P.foxii ♂ catches
Figure 87a.
P. fusca ♂ catches
Figure 87b.
P. fusca ♂ catches
Figure 87c.
P. fusca ♂ catches
Figure 87d.
P. fusca ♂ catches
Figure 88a.
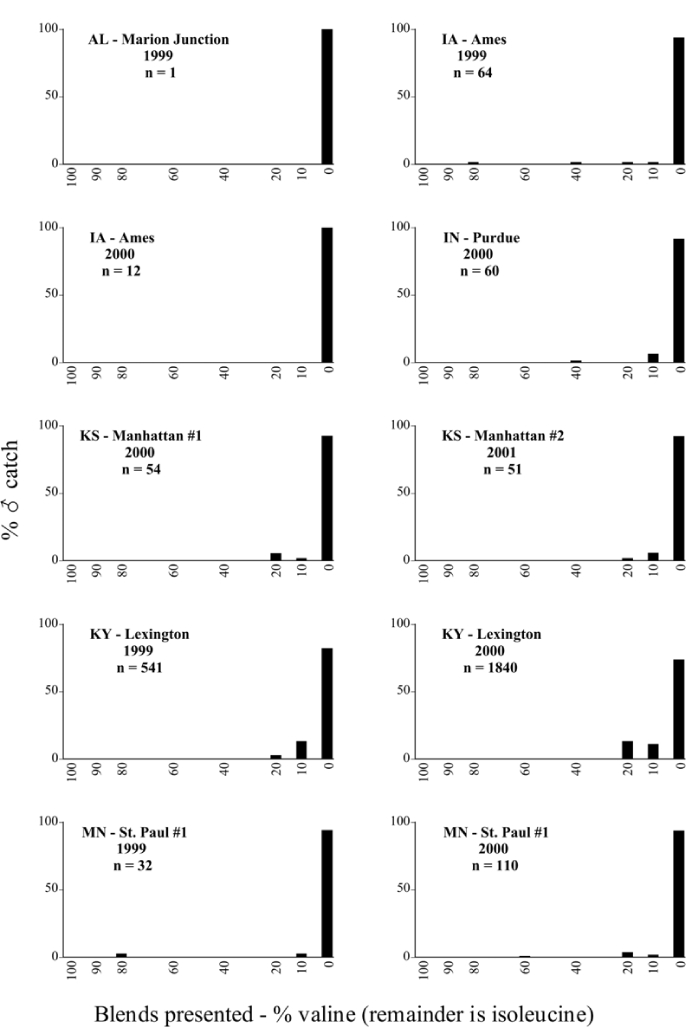
P. futilis ♂ catches
Figure 88b.
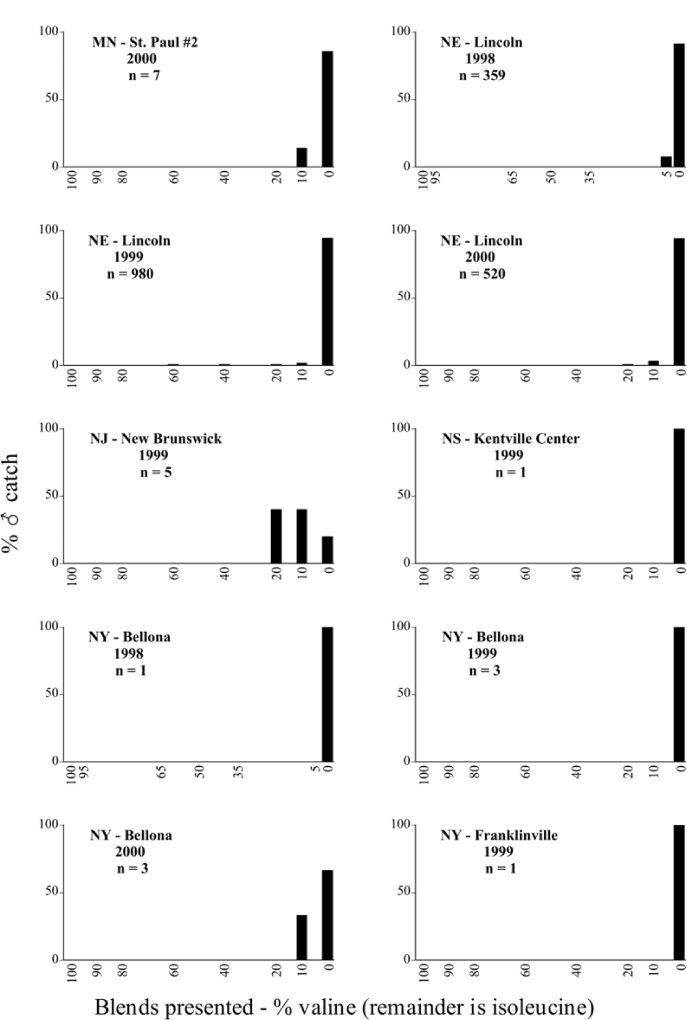
P. futilis ♂ catches
Figure 88c.
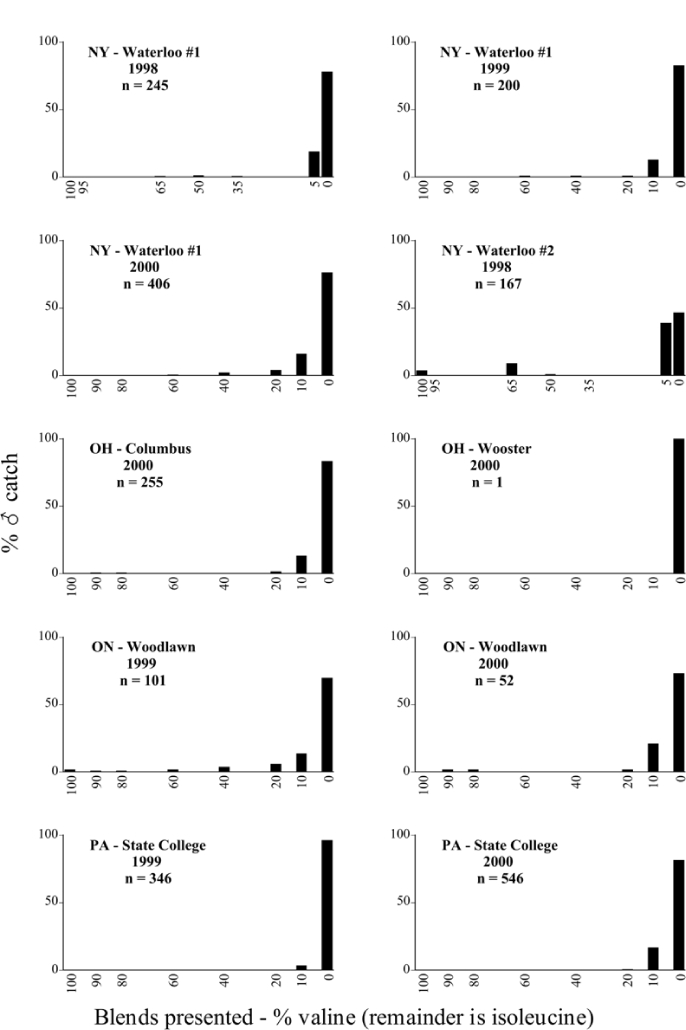
P. futilis ♂ catches
Figure 88d.

P. futilis ♂ catches
Figure 90.
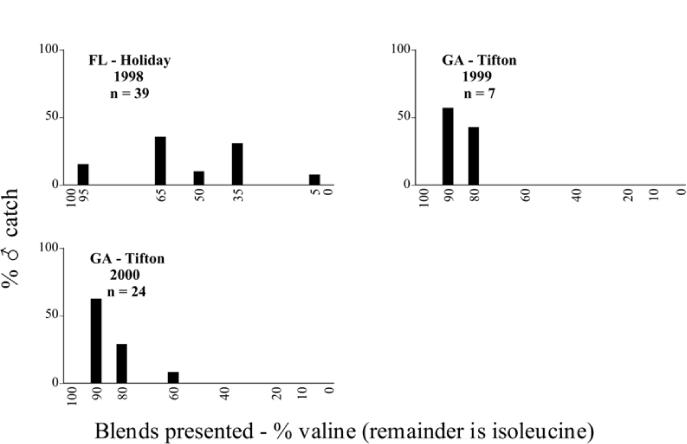
P. glaberrima ♂ catches
Figure 91.
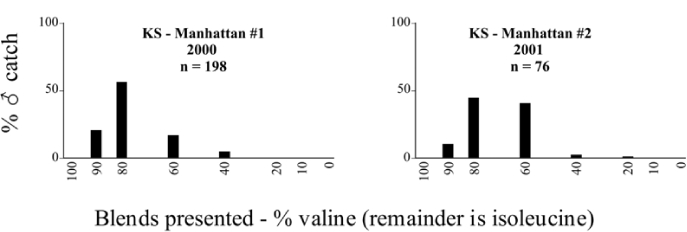
P. glabricula ♂ catches
Figure 94.
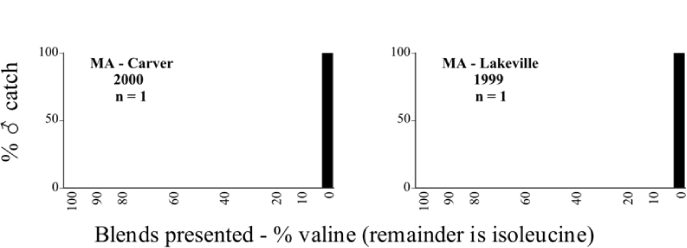
P. hirsuta ♂ catches
Figure 97.
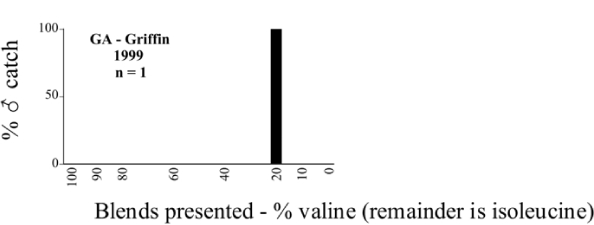
P. ilicis ♂ catches
Figure 98.

P. implicita ♂ catches
Figure 99.
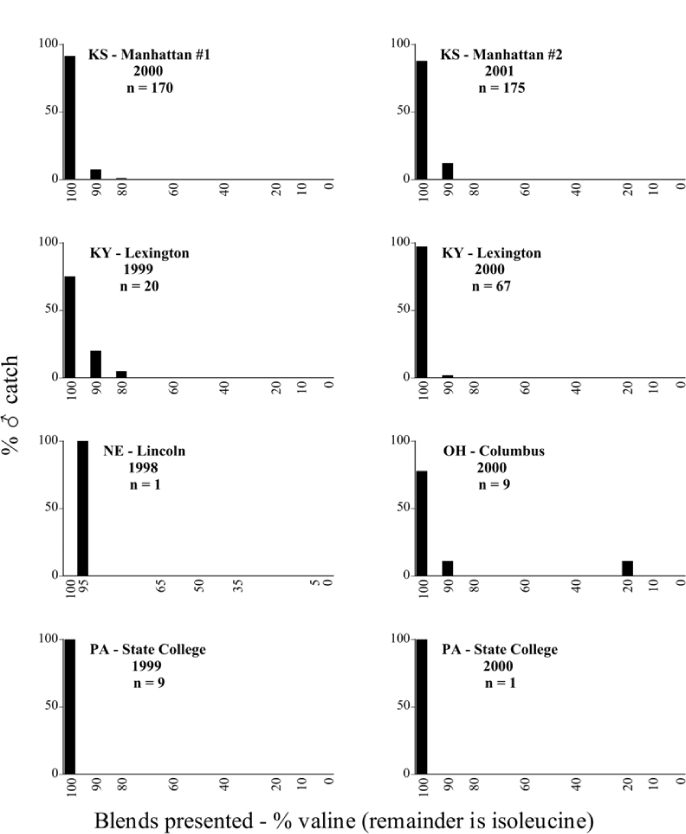
P. inversa ♂ catches
Figure 100.
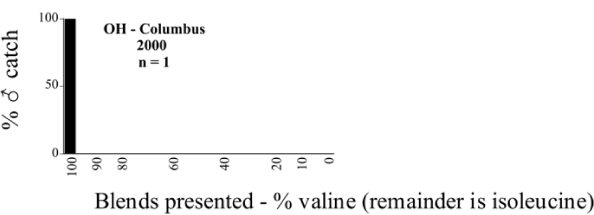
P. kentuckiana ♂ catches
Figure 101.
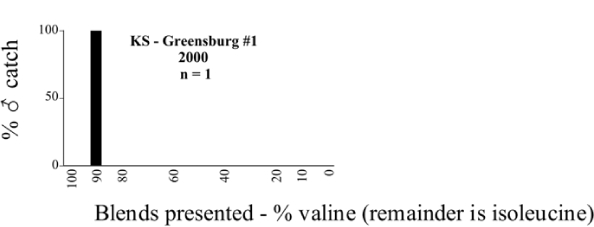
P. lanceolata ♂ catches
Figure 102.
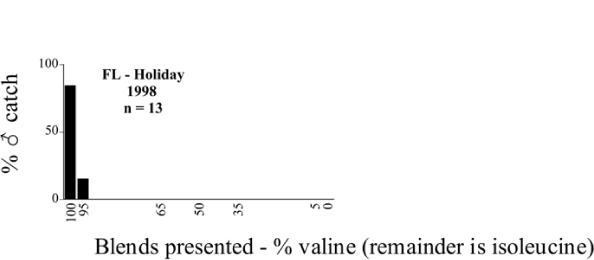
P. latifrons ♂ catches
Figure 103.
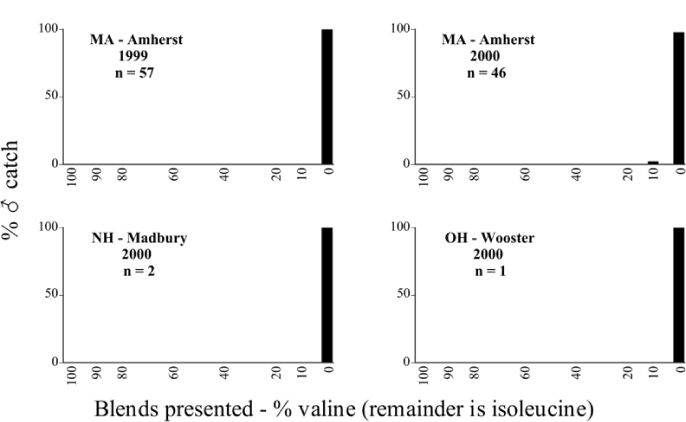
P. longispina ♂ catches
Figure 104.
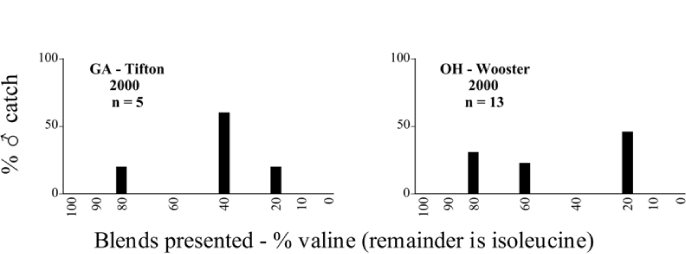
lota ♂ catches
Figure 105.
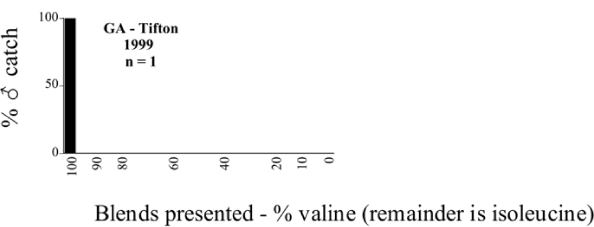
P. luctuosa ♂ catches
Figure 106.
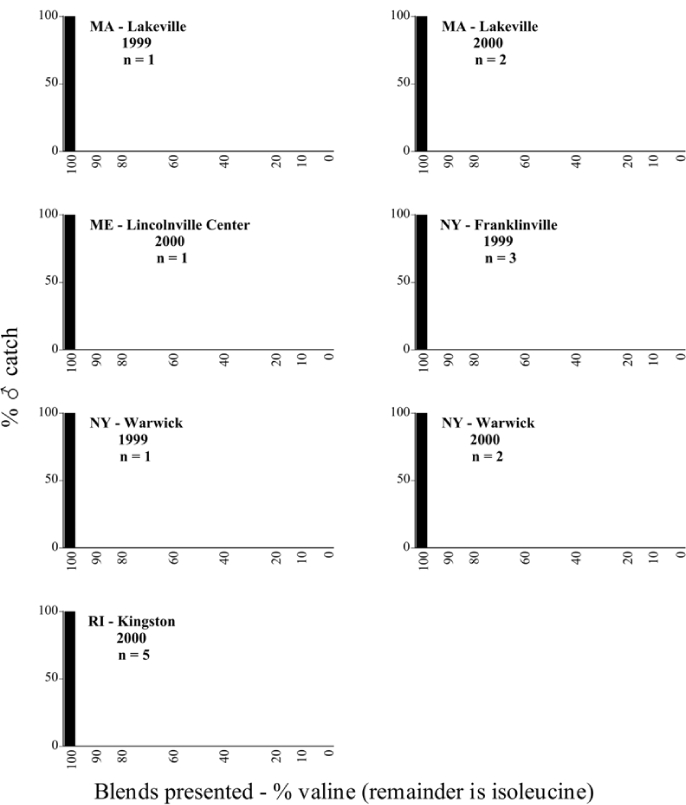
P. marginalis ♂ catches
Figure 108.

P. micans ♂ catches
Figure 109.
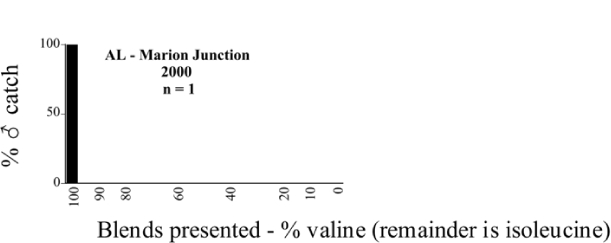
P. (fraterna) mississippiensis ♂ catches
Figure 110.

P. nitida ♂ catches
Figure 111.
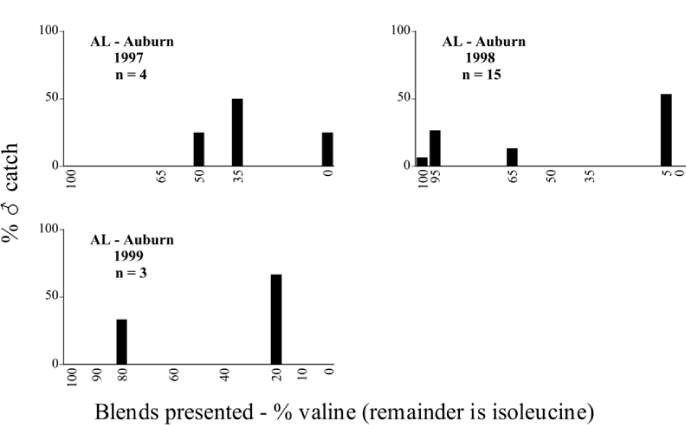
P. obsoleta ♂ catches
Figure 112.
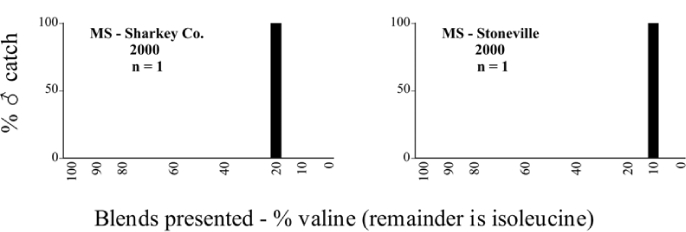
P. perlonga ♂ catches
Figure 113.
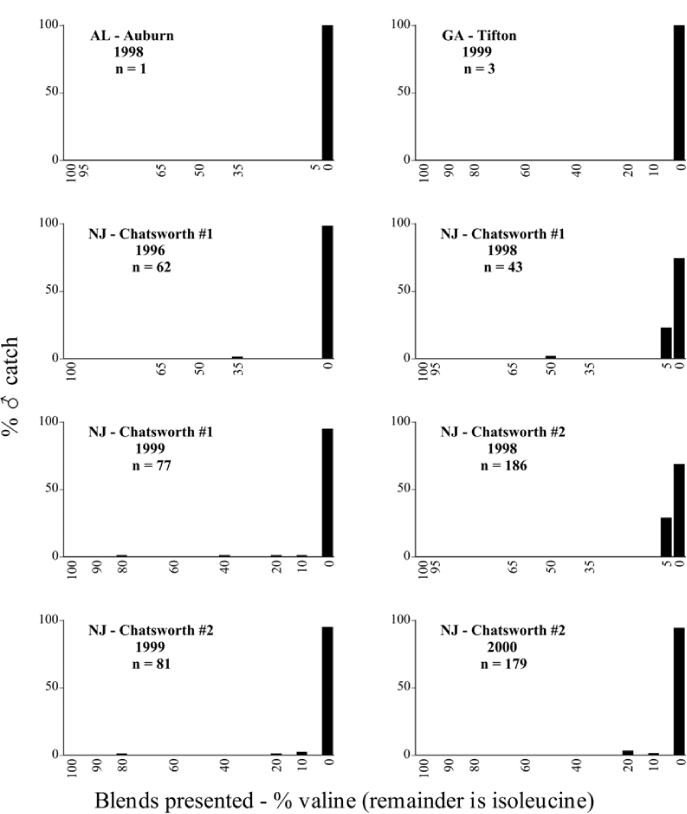
P. postrema ♂ catches
Figure 114.
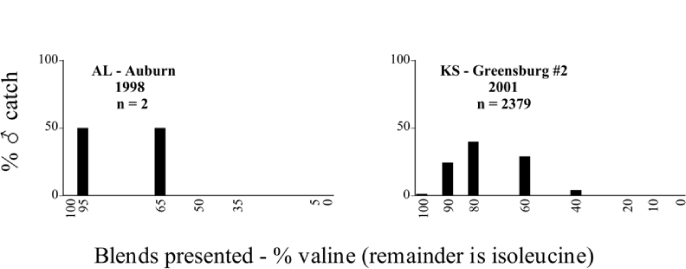
P. praetermissa ♂ catches
Figure 115.
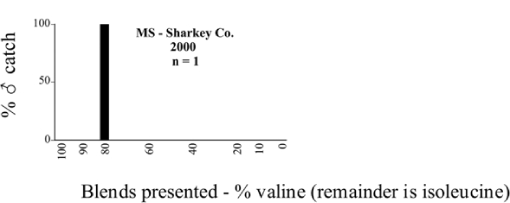
P. profunda ♂ catches
Figure 116.
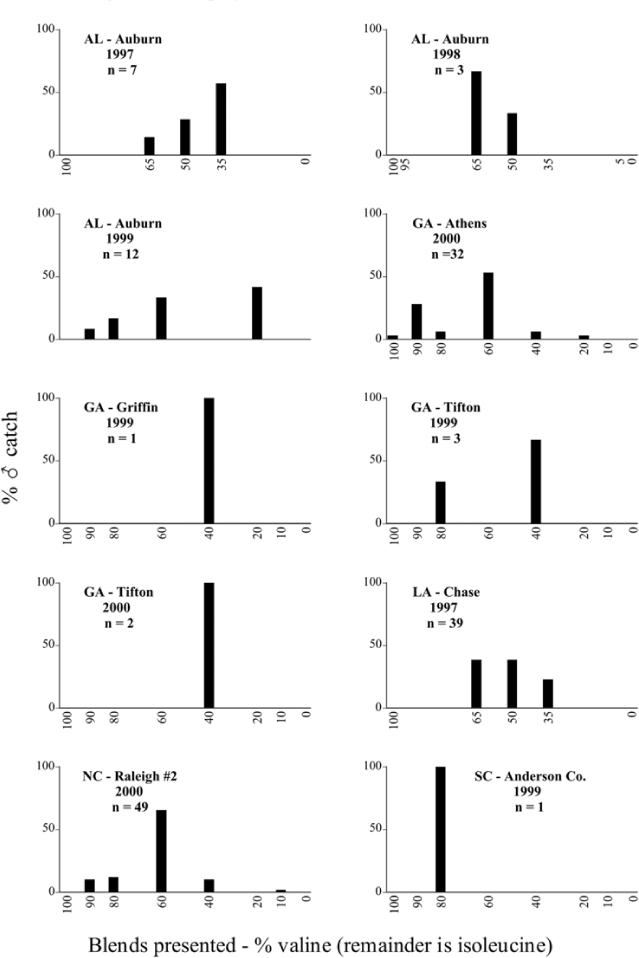
P. quercus ♂ catches
Figure 117.
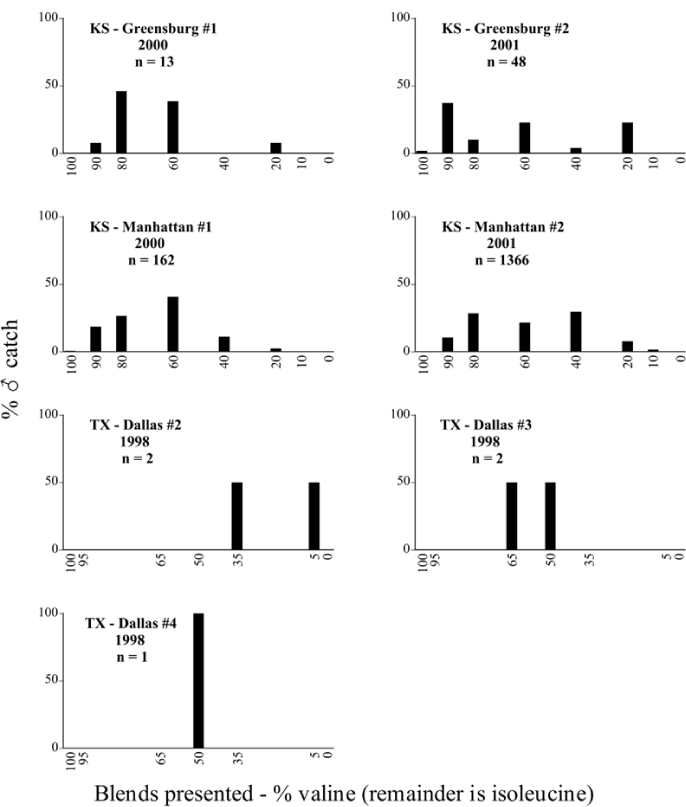
P. rubiginosa ♂ catches
Figure 118a.
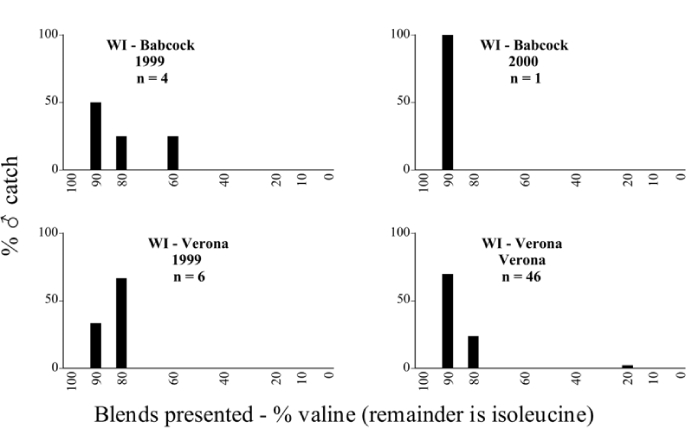
P. rugosa ♂ catches
Figure 118b.
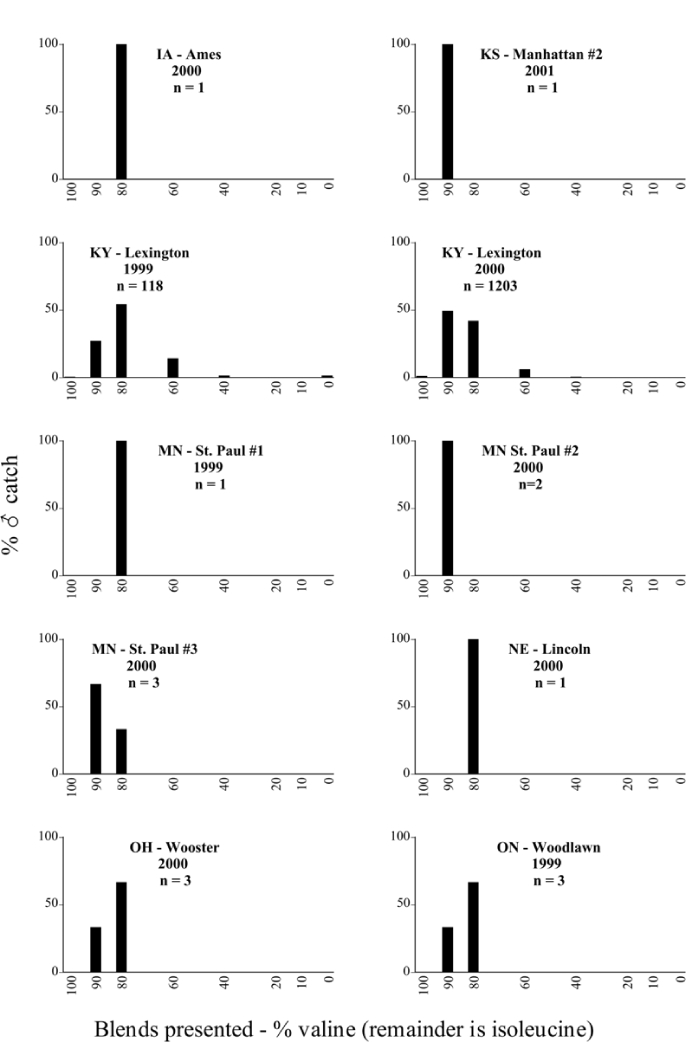
P. rugosa ♂ catches
Figure 119.
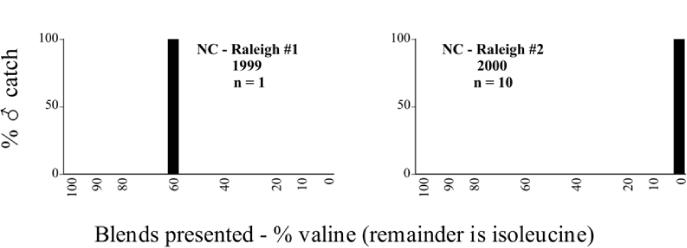
P. soror ♂ catches
Figure 120.
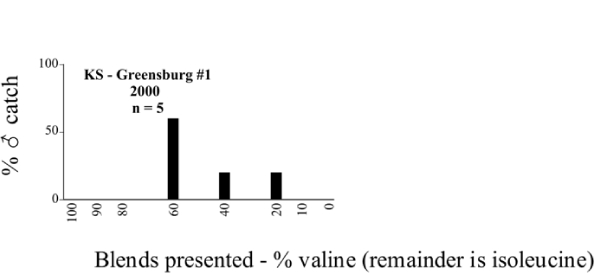
P. submucida ♂ catches
Figure 123.
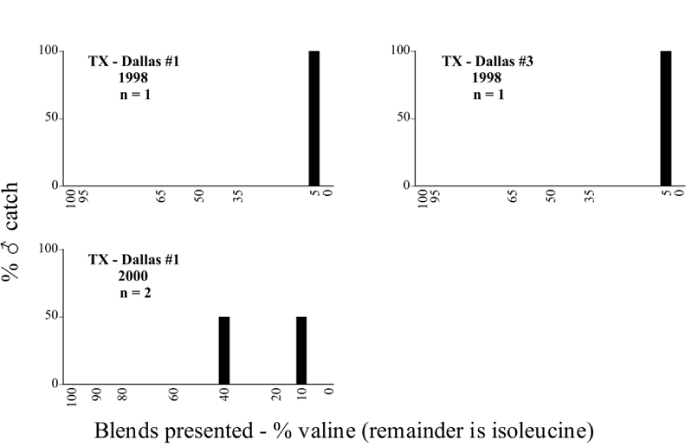
torta ♂ catches
Figure 124.
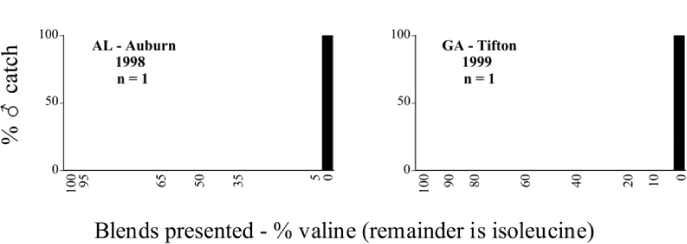
P. ulkei ♂ catches
Figure 125.
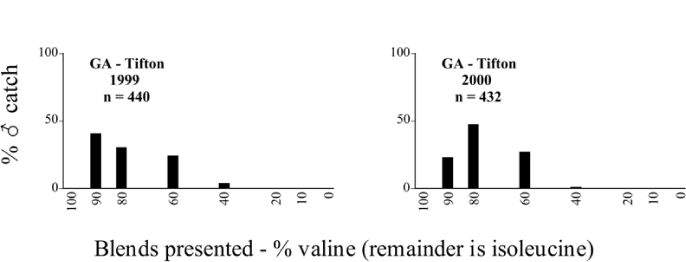
P. uniformis ♂ catches
Figure 126.
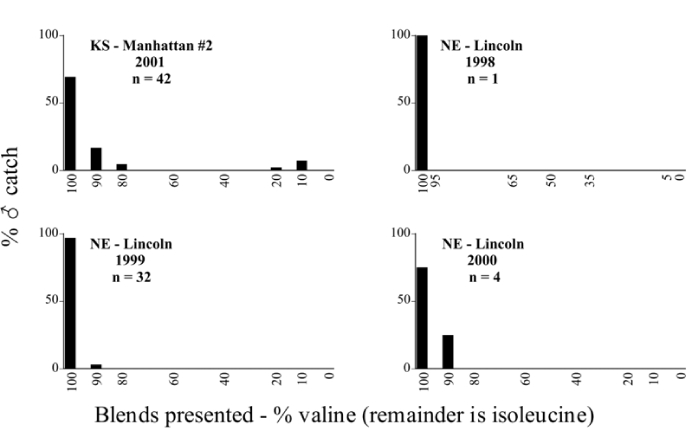
P. vehemens ♂ catches
Table 60.
New Jersey, Chatsworth #2 2000
Blends indicate the ratio of the methyl esters of L-valine/L-isoleucine

Table 61.
New Jersey, Hammonton 1996
Blends indicate the ratio of the methyl esters of L-valine/L-isoleucine

Table 62.
New Jersey, New Brunswick 1999
Blends indicate the ratio of the methyl esters of L-valine/L-isoleucine

Table 63.
New York, Bellona 1998
Blends indicate the ratio of the methyl esters of L-valine/L-isoleucine

Table 64.
New York, Bellona 1999
Blends indicate the ratio of the methyl esters of L-valine/L-isoleucine

Table 65.
New York, Bellona 2000
Blends indicate the ratio of the methyl esters of L-valine/L-isoleucine

Table 66.
New York, Franklinville 1999
Blends indicate the ratio of the methyl esters of L-valine/L-isoleucine

Table 67.
New York, Riverhead 1999
Blends indicate the ratio of the methyl esters of L-valine/L-isoleucine

Table 68.
New York, Saratoga Springs 1999
Blends indicate the ratio of the methyl esters of L-valine/L-isoleucine

Table 69.
New York, Saratoga Springs 2000
Blends indicate the ratio of the methyl esters of L-valine/L-isoleucine

Table 70.
New York, Warwick 1999
Blends indicate the ratio of the methyl esters of L-valine/L-isoleucine

Table 71.
New York, Warwick 2000
Blends indicate the ratio of the methyl esters of L-valine/L-isoleucine

Table 72.
New York, Waterloo #1 1998
Blends indicate the ratio of the methyl esters of L-valine/L-isoleucine

Table 73.
New York, Waterloo #1 1999
Blends indicate the ratio of the methyl esters of L-valine/L-isoleucine

Table 74.
New York, Waterloo #1 2000
Blends indicate the ratio of the methyl esters of L-valine/L-isoleucine

Table 75.
New York, Waterloo #2 1998
Blends indicate the ratio of the methyl esters of L-valine/L-isoleucine

Table 76.
North Carolina, Raleigh #1 1999
Blends indicate the ratio of the methyl esters of L-valine/L-isoleucine

Table 77.
North Carolina, Raleigh #2 2000
Blends indicate the ratio of the methyl esters of L-valine/L-isoleucine

Table 78.
Ohio, Columbus 2000
Blends indicate the ratio of the methyl esters of L-valine/L-isoleucine

Table 79.
Ohio, Wooster 2000
Blends indicate the ratio of the methyl esters of L-valine/L-isoleucine

Table 82.
Rhode Island, Kingston 1999
Blends indicate the ratio of the methyl esters of L-valine/L-isoleucine

Table 83.
Rhode Island, Kingston 2000
Blends indicate the ratio of the methyl esters of L-valine/L-isoleucine

Table 84.
South Carolina, Anderson County 1999
Blends indicate the ratio of the methyl esters of L-valine/L-isoleucine

Table 85.
Texas, Dallas #1 1998
Blends indicate the ratio of the methyl esters of L-valine/L-isoleucine

Table 86.
Texas, Dallas #1 1999
Blends indicate the ratio of the methyl esters of L-valine/L-isoleucine

Table 87.
Texas, Dallas #1 2000
Blends indicate the ratio of the methyl esters of L-valine/L-isoleucine

Table 88.
Texas, Dallas #2 1998
Blends indicate the ratio of the methyl esters of L-valine/L-isoleucine

Table 89.
Texas, Dallas #3 1998
Blends indicate the ratio of the methyl esters of L-valine/L-isoleucine

Table 90.
Texas, Dallas #4 1998
Blends indicate the ratio of the methyl esters of L-valine/L-isoleucine

Table 92.
Vermont, Burlington 1999
Blends indicate the ratio of the methyl esters of L-valine/L-isoleucine

Table 93.
Vermont, Burlington 2000
Blends indicate the ratio of the methyl esters of L-valine/L-isoleucine

Table 94.
Wisconsin, Babcock 1999
Blends indicate the ratio of the methyl esters of L-valine/L-isoleucine

Table 95.
Wisconsin, Babcock 2000
Blends indicate the ratio of the methyl esters of L-valine/L-isoleucine

Table 96.
Wisconsin, Verona 1999
Blends indicate the ratio of the methyl esters of L-valine/L-isoleucine

Table 97.
Wisconsin, Verona 2000
Blends indicate the ratio of the methyl esters of L-valine/L-isoleucine

Table 98a.
Synchronic species captured by the same or nearby sex attractant blends, by state.
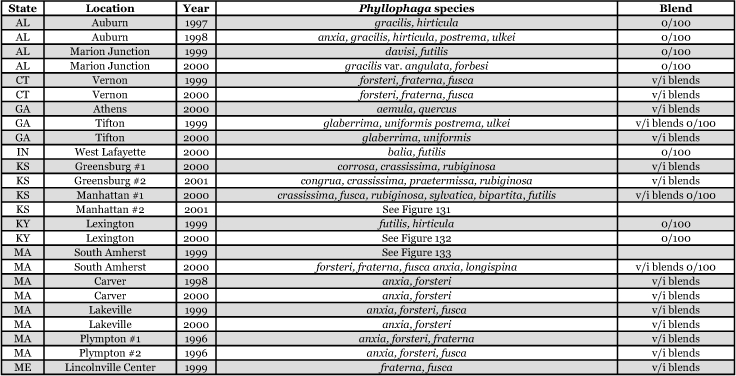
Table 98b.
Synchronic species captured by the same or nearby sex attractant blends, by state.
Summary and Conclusions
This study demonstrates the extensive use of the methyl esters of L-valine and L-isoleucine in the mate recognition systems of a widely distributed and speciose taxon. Since each trapping site is a snapshot of activity over a very restricted area, it is compelling that nearly 40% of the Phyllophaga (sensu stricto) species in America north of Mexico were captured, despite all the possible locations that were not trapped.
Consistency in male response among geographically separated populations of conspecifics was demonstrated in numerous examples. This was useful to document in itself because it provided information concerning sex attractant use in a taxon that had never before been investigated in this fashion. However, this information also served, perhaps more importantly, to contrast and highlight the unusual geographic variation in male response to sex attractants between various populations of P. anxia and in a more minor way, P. fraterna.
This study also documents the interspecific interactions between Phyllophaga species, through both literature citations and capture results. These interactions may be as benign as attraction to congeneric females (Eberhard 1993), with presumably little or no accompanying loss of fitness, or may involve copulation and perhaps exchange of genetic material (Fattig 1944), resulting in a more expensive or even fatal conclusion. Interactions between species are of great interest because of their connection to both species concepts and hybridization studies (Arnold 1997, Claridge et al. 1997, Rand and Harrison 1989).
Since this trapping study was terminated in 2001, additional research on sex pheromones of the Phyllophaga has been accomplished that extends the understanding of mate finding in this large genus. This research will have bearing on the phylogenetic relationships of this group as well.
The sex pheromone of Phyllophaga crinita was identified as methyl 2-(methylthio)benzoate (Robbins et al. 2003). Interestingly, Coca-Abia (2002) has recently resurrected the genus Trichesthes and removed P. crinita as well as a number of other species from the Phyllophaga (sensu stricto) to Trichesthes. Among the species moved to Trichesthes were P. lenis and P. tristis, two species that have also been captured in large numbers using methyl 2-(methylthio)benzoate (P.S. Robbins, unpublished data).
The sex pheromone of Phyllophaga (Tostegoptera) lanceolata was identified as L-leucine methyl ester (Nojima et al. 2003). Tostegoptera is a small sub-genus of the Phyllophaga consisting of only two species, Phyllophaga (Tostegoptera) lanceolata and Phyllophaga (Tostegoptera) squamipilosa. Both species have been captured using L-leucine methyl ester and field tests have demonstrated that L-valine and L-isoleucine methyl esters function as antagonists to Phyllophaga (Tostegoptera) lanceolata males.
Acknowledgments
This study would not have been accomplished without the participation of my co-authors. I am deeply grateful for their persistence and attention to detail. Donna Boyce, Joe Ogrodnick, and Rob Way of Communication Services here at the New York State Agricultural Experiment Station in Geneva provided the artistic guidance and technical input to produce the excellent figures seen in this publication. Thanks go to Nancy Consolie, my lab partner in the Villani soil insect lab at Cornell University for more than 13 years. Her research suggestions and invariable good humor added to this project. Marta Luisa del Campo, Anuar Morales, and Rebecca Smyth of Cornell University and Miguel Ángel Morón of the Instituto de Ecologia in Xalapa, Mexico, all contributed to making the Spanish abstract clear and understandable. My dissertation committee at Cornell University, consisting of Drs. Cole Gilbert, Rick Harrison, Charlie Linn, Wendell Roelofs, and Mike Villani, were patient and encouraging during this long study. A special note of thanks to Mike Villani who did not live to see this work published. Thanks, Mike, for encouraging me to follow the muses.
Footnotes
1 see Figure 99, P. inversa; Figure 102, P. latifrons; Figure 106, P. marginalis; Figure 126, P. vehemens
2 see Figure 68, P. balia; Figure 69, P. bipartita; Figure 74, P. crenulata; Figures 79a and 79b, P. drakei; Figure 82, P. forbesi; Figures 88a, 88b, 88c, and 88d, P. futilis; Figure 92, P. gracilis; Figure 94, P. hirsuta; Figure 95, P. hirticula; Figure 103, P. longispina; Figure 113, P. postrema; Figure 124, P. ulkei
3 see Figure 64, P. aemula; Figure 65, P. affabilis; Figure 72, P. corrosa; Figures 73a and 73b, P. crassissima; Figures 83a, 83b, and 83c, P. forsteri; Figures 85a and 85b, P. fraterna; Figures 87a, 87b, 87c, and 87d, P. fusca; Figure 90, P. glaberrima; Figure 91, P. glabricula; Figure 104, P. lota; Figure 107, P. mariana; Figure 108, P. micans; Figure 112, P. perlonga; Figure 114, P. praetermissa; Figure 116, P. quercus; Figure 117, P. rubiginosa; Figures 118a and 118b, P. rugosa; Figure 121, P. sylvatica; Figure 123, P. torta; Figure 125, P. uniformis
4 see Figures 73a and 73b, P. crassissima; Figures 87a, 87b, 87c, and 87d, P. fusca; Figure 117, P. rubiginosa
5 see Figure 64, P. aemula; Figure 65, P. affabilis; Figures 83a, 83b, and 83c, P. forsteri; Figures 85a and 85b, P. fraterna; Figures 118a and 118b, P. rugosa; Figure 125, P. uniformis
6 see Figure 64, P. aemula; Figure 65, P. affabilis; Figure 69, P. bipartita; Figure 72, P. corrosa; Figure 91, P. glabricula; Figure 107, P. mariana; and Figure 125, P. uniformis
7 see Figures 11, 73a and 73b, P. crassissima; Figures 12 and 74, P. crenulata; Figures 17, 79a and 79b, P. drakei; Figures 20 and 82, P. forbesi; Figures 21, 83a, 83b, and 83c, P. forsteri; Figures 23, 85a and 85b, P. fraterna; Figures 24, 87a, 87b, 87c, and 87d, P. fusca; Figures 25, 88a, 88b, 88c, and 88d, P. futilis; Figures 27 and 90, P. glaberrima; Figures 29 and 92, P. gracilis; Figures 31 and 94, P. hirsuta; Figures 32 and 95, P. hirticula; Figures 33 and 96, P. hirtiventris; Figures 36 and 99, P. inversa; Figures 40 and 103, P. longispina; Figures 41 and 104, P. lota; Figures 43 and 106, P. marginalis; Figures 45 and 108, P. micans; Figures 47 and 110, P. nitida; Figures 49 and 112, P. perlonga; Figures 50 and 113, P. postrema; Figures 51 and 114, P. praetermissa; Figures 53 and 116, P. quercus; Figures 54 and 117, P. rubiginosa; Figures 55, 118a and 118b, P. rugosa; Figures 58 and 121, P. sylvatica; Figures 60 and 123, P. torta; Figures 61 and 124, P. ulkei; and Figures 63 and 126, P. vehemens
References
- Andre F. White grub devastations in Iowa nurseries. Journal of Economic Entomology. 1937;30:615–618.. [Google Scholar]
- Arnold ML. Natural Hybridization and Evolution. Oxford University Press.; 1997. [Google Scholar]
- Bessin RT. White grub control in no-till field corn, 1998. In: Saxena KN, editor. Arthropod Management Tests. Lanham, Maryland: Entomological Society of America.; 1999. p. 207. editor. [Google Scholar]
- Brandenburg RL, Villani MG, editors. Handbook of Turfgrass Insect Pests. Lanham, Maryland: Entomological Society of America.; 1995. [Google Scholar]
- Claridge MF, Dawah HA, Wilson MR, editors. Species: The Units of Diversity. London: Chapman and Hall.; 1997. [Google Scholar]
- Coca-Abia MM. Reestablishment of the genus Trichesthes Erichson, 1847 (Coleoptera: Scarabaeidae, Melolonthinae) based on phylogeny. Journal of the New York Entomological Society. 2002;110:95–114.. [Google Scholar]
- Dunn JB, Averill AL. Survey of soil scarab insects in Massachusetts. Cranberries. 1996;60:9–12.. 22–23.. [Google Scholar]
- Eberhard WG. Sexual Selection and Animal Genitalia. Harvard University Press.; 1985. [Google Scholar]
- Eberhard WG. Species isolation, genital mechanics, and the evolution of species-specific genitalia in three species of Macrodactylus beetles (Coleoptera, Scarabaeidae, Melolonthinae). Evolution. 1992;46:1774–1783.. doi: 10.1111/j.1558-5646.1992.tb01168.x. [DOI] [PubMed] [Google Scholar]
- Eberhard WG. Copulatory courtship and morphology of genitalic coupling in seven Phyllophaga species (Coleoptera: Melolonthidae). Journal of Natural History. 1993;27:683–717.. [Google Scholar]
- Eberhard WG. Functional significance of some secondary sexual characters in three species of Macrodactylus (Coleoptera: Melolonthidae). Coleopterists Bulletin. 1993;47:53–60.. [Google Scholar]
- Eberhard WG. Female control: sexual selection by cryptic female choice. Princeton University Press.; 1996. [Google Scholar]
- Eck P. The American Cranberry. Rutgers University Press.; 1990. [Google Scholar]
- Evans AV. A checklist of the New World chafers (Coleoptera: Scarabaeidae: Melolonthinae). Zootaxa. 2003;211:1–458.. [Google Scholar]
- Fattig PW. The Phyllophaga or May beetles of Georgia. Atlanta, GA: Emory University.; 1944. [Google Scholar]
- Francke W, Dettner K. Chemical signalling in beetles. In: Schulz S, editor. Topics In Current Chemistry. Berlin: Springer-Verlag.; 2005. pp. 85–166.. editor. [Google Scholar]
- Franklin HJ. Cranberry insects of Massachusetts. Bulletin 445. Parts II–VII. Massachusetts: Agricultural Experiment Station.; 1950. [Google Scholar]
- Glover TJ, Knodel JJ, Robbins PS, Eckenrode CJ, Roelofs WL. Gene flow among three races of European corn borers (Lepidoptera: Pyralidae) in New York state. Environmental Entomology. 1991;20:1356–1362.. [Google Scholar]
- Gordon RD, Anderson DM. The species of Scarabaeidae (Coleoptera) associated with sugarcane in south Florida. Florida Entomologist. 1981;64:119–138.. [Google Scholar]
- Hammond A, Story RN, Murray MJ, McCown CR, Ring D. Evaluation of selected soil and foliar insecticides on sweet potatoes for control of white grubs and banded cucumber beetles, 1995. In: Saxena KN, editor. Arthropod Management Tests. Lanham, Maryland: Entomological Society of America.; 1997. pp. 169–170.. editor. [Google Scholar]
- Katovich K, Levine SJ, Young DK. Characterization and usefulness of soil-habitat preferences in identification of Phyllophaga (Coleoptera: Scarabaeidae) larvae. Annals of the Entomological Society of America. 1998;91:288–297.. [Google Scholar]
- Klun JA. Insect sex pheromones: Intraspecific pheromonal variability of Ostrinia nubilalis in North America and Europe. Environmental Entomology. 1975;4:891–894.. Cooperators. [Google Scholar]
- Langston J. Phyllophaga of Mississippi. 1927. Technical Bulletin No. 15. Mississippi Agricultural Experiment Station.
- Leal WS, Matsuyama S, Kuwahara Y, Wakamura S, Hasegawa M. An amino acid derivative as the sex pheromone of a scarab beetle. Naturwissenschaften. 1992;79:184–185.. [Google Scholar]
- Luginbill P, Painter HR. May Beetles of the United States and Canada. 1953. Technical Bulletin No. 1060. United States Department of Agriculture.
- McElfresh JS, Millar JG. Geographic variation in the pheromone system of the saturniid moth Hemileuca eglanterina. Ecology. 2001;82:3505–3518.. [Google Scholar]
- Nojima S, Robbins PS, Salsbury GA, Morris BD, Roelofs WL, Villani MG. L-leucine methyl ester: The female-produced sex pheromone of the scarab beetle Phyllophaga lanceolata. Journal of Chemical Ecology. 2003;29:2439–2446.. doi: 10.1023/a:1026349716070. [DOI] [PubMed] [Google Scholar]
- Rand DM, Harrison RG. Ecological genetics of a mosaic hybrid zone: Mitochondrial, nuclear, and reproductive diferentiation of crickets by soil type. Evolution. 1989;43:432–449.. doi: 10.1111/j.1558-5646.1989.tb04238.x. [DOI] [PubMed] [Google Scholar]
- Ratcliffe BC. The Scarab Beetles of Nebraska. Bulletin of the University of Nebraska State Museum.; 1991. [Google Scholar]
- Riley EG.1988. The Phyllophaga of Louisiana (Coleoptera: Scarabaeidae) Department of Entomology, M.S. Thesis. Louisiana State University.
- Robbins PS, Crocker RL, Nojima S, Morris BD, Roelofs WL, Villani MG. Methyl 2-(methylthio)benzoate: the unique sulfur-containing sex pheromone of Phyllophaga crinita. Naturwissenschaften. 2003;90:517–520.. doi: 10.1007/s00114-003-0469-5. [DOI] [PubMed] [Google Scholar]
- Roelofs WL. Threshold hypothesis for pheromone perception. Journal of Chemical Ecology. 1978;4:685–699.. [Google Scholar]
- Saylor L. Necessary changes in status of important Rhizotrogid genera (Col. Scarabaeidae). Revista de Entomologia. 1937;7:318–322.. [Google Scholar]
- Saylor LW. Revision of the beetles of the Melolonthine subgenus Phytalus of the United States. Proceedings of the United States National Museum. 1939;86:157–167.. [Google Scholar]
- Saylor LW. Revision of the scarabaeid beetles of the Phyllophagan subgenus Listrochelus of the United States, with discussion of related subgenera. Proceedings of the United States National Museum. 1940;89:59–130.. [Google Scholar]
- Smith ABT, Evans AV. A supplement to the checklist of the New World chafers (Coleoptera: Scarabaeidae: Melolonthinae) with notes on their tribal classification. Zootaxa. 2005;1032:29–60.. [Google Scholar]
- Smith JB. Notes on some Lachnosterna of temperate North America, with descriptions of new species. Proceedings of the United States National Museum. 1888;11:481–525.. [Google Scholar]
- Sota T, Kubota K. Genital lock-and-key as a selective agent against hybridization. Evolution. 1998;52:1507–1513.. doi: 10.1111/j.1558-5646.1998.tb02033.x. [DOI] [PubMed] [Google Scholar]
- Vittum PJ, Villani MG, Tashiro H. Turfgrass Insects of the United States and Canada. 2nd Edition. Cornell University Press.; 1999. [Google Scholar]
- Woodruff RE. Gainesville: Florida Department of Agriculture and Consumer Services. Division of Plant Industry.; 1961. A Cuban May beetle, Phyllophaga (Cnemarachis) bruneri, in Miami, Florida (Coleoptera: Scarabaeidae). [Google Scholar]
- Woodruff RE, Beck BE. Gainesville: Florida Department of Agriculture and Consumer Services. Division of Plant Industry.; 1989. The scarab beetles of Florida (Coleoptera: Scarabaeidae) Part II. The May or June beetles (genus Phyllophaga). Arthropods of Florida and Neighboring Land Areas. 13. [Google Scholar]
- Woodruff RE, Sanderson MW. Revision of the Phyllophaga of Hispaniola (Scarabaeidae: Melolonthinae). Insecta Mundi. 2004;18:1–154.. [Google Scholar]
- Wu W, Cottrell CB, Hansson BS, Löfstedt C. Comparative study of pheromone production and response in Swedish and Zimbabwean populations of turnip moth, Agrotis segetum. Journal of Chemical Ecology. 1999;25:177–196.. [Google Scholar]
- Zhang A, Robbins PS, Leal WS, Linn CE, Villani MG, Roelofs WL. Essential amino acid methyl esters: major sex pheromone components of the cranberry white grub, Phyllophaga anxia (Coleoptera: Scarabaeidae). Journal of Chemical Ecology. 1997;23:231–245.. [Google Scholar]


