Figure 132.

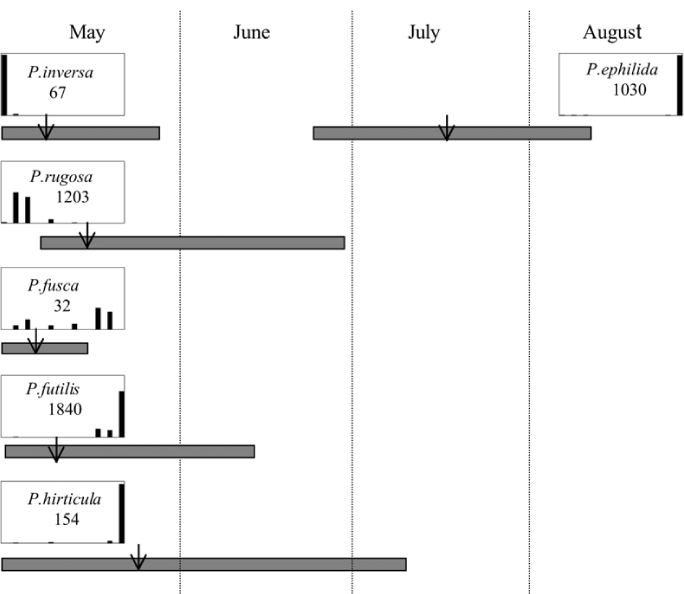
Kentucky, Lexington, 2000. Timing and duration of flight and ♂ pheromone response curves. Arrow indicates numerical midpoint of flight.

Kentucky, Lexington, 2000. Timing and duration of flight and ♂ pheromone response curves. Arrow indicates numerical midpoint of flight.