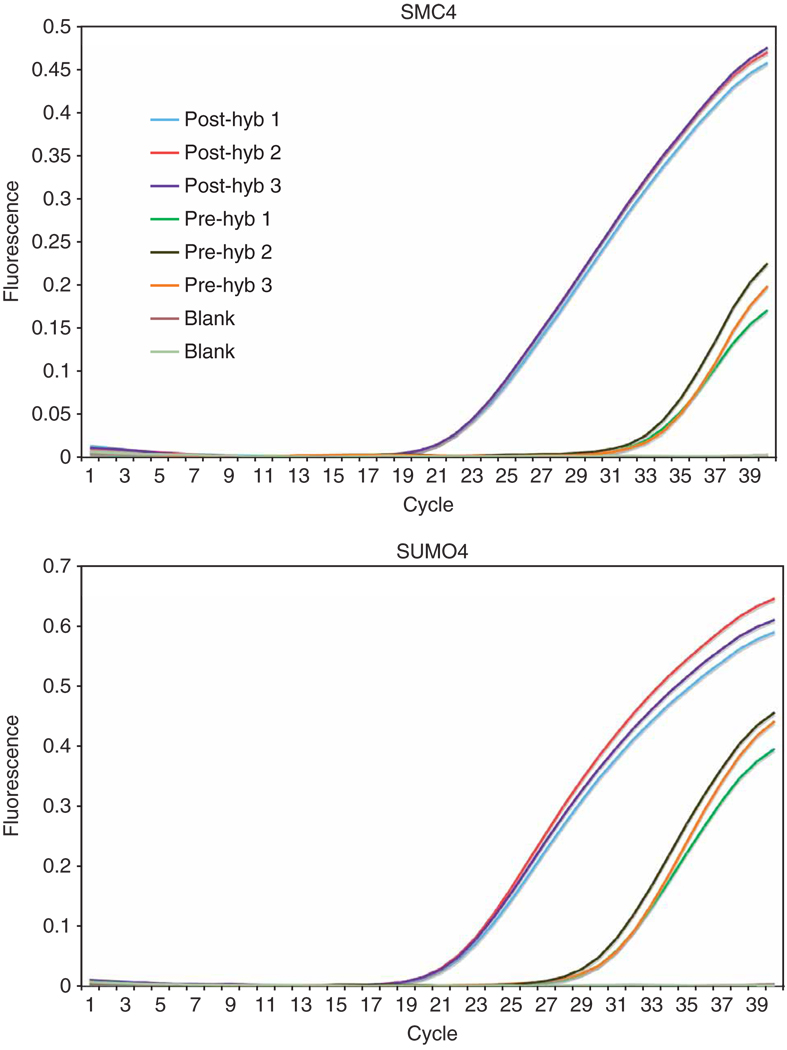
Figure 4.
qPCR analysis of two selected exons. qPCRs were carried out in triplicate for individually selected exons on both the input material (pre-hyb genomic DNA) and the enriched material (post-hyb). The differential CT values between ‘pre’ and ‘post’ array capture give a clear indication that the purification of the exons has succeeded. Non-selected exons may also be included (data not shown) in this analysis to confirm depletion of unselected targets.

